|
Download Data (XLS File) |
|
|||||
|
|||||
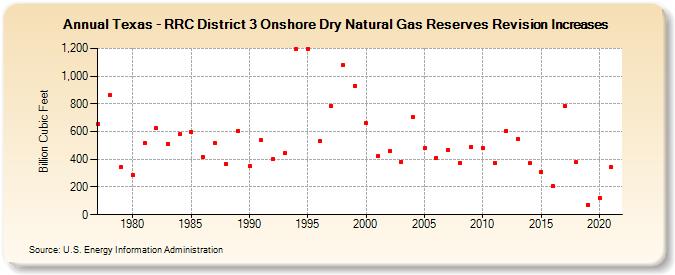
| Texas - RRC District 3 Onshore Dry Natural Gas Reserves Revision Increases (Billion Cubic Feet) | |||||
| Decade | Year-0 | Year-1 | Year-2 | Year-3 | Year-4 | Year-5 | Year-6 | Year-7 | Year-8 | Year-9 |
|---|---|---|---|---|---|---|---|---|---|---|
| 1970's | 654 | 864 | 341 | |||||||
| 1980's | 288 | 517 | 623 | 513 | 579 | 598 | 416 | 518 | 369 | 607 |
| 1990's | 349 | 537 | 401 | 442 | 1,198 | 1,197 | 531 | 784 | 1,079 | 932 |
| 2000's | 659 | 422 | 460 | 383 | 704 | 478 | 411 | 470 | 376 | 490 |
| 2010's | 482 | 375 | 604 | 547 | 370 | 310 | 205 | 787 | 379 | 73 |
| 2020's | 123 | 342 |
| - = No Data Reported; -- = Not Applicable; NA = Not Available; W = Withheld to avoid disclosure of individual company data. |
| Release Date: 12/30/2022 |
| Next Release Date: NA |