|
Download Data (XLS File) |
|
|||||
|
|||||
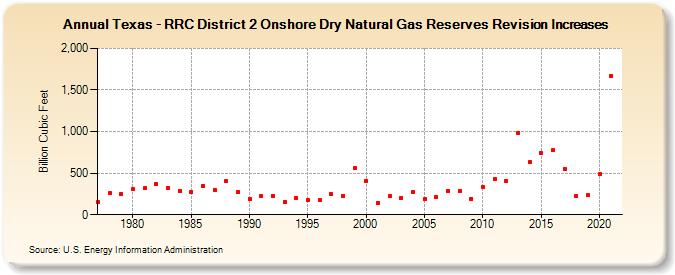
| Texas - RRC District 2 Onshore Dry Natural Gas Reserves Revision Increases (Billion Cubic Feet) | |||||
| Decade | Year-0 | Year-1 | Year-2 | Year-3 | Year-4 | Year-5 | Year-6 | Year-7 | Year-8 | Year-9 |
|---|---|---|---|---|---|---|---|---|---|---|
| 1970's | 148 | 256 | 247 | |||||||
| 1980's | 305 | 317 | 371 | 323 | 291 | 277 | 349 | 300 | 400 | 277 |
| 1990's | 191 | 222 | 231 | 150 | 206 | 178 | 175 | 248 | 231 | 556 |
| 2000's | 411 | 146 | 222 | 205 | 272 | 188 | 209 | 282 | 286 | 190 |
| 2010's | 333 | 425 | 403 | 985 | 633 | 745 | 778 | 548 | 228 | 232 |
| 2020's | 493 | 1,667 |
| - = No Data Reported; -- = Not Applicable; NA = Not Available; W = Withheld to avoid disclosure of individual company data. |
| Release Date: 12/30/2022 |
| Next Release Date: NA |