|
Download Data (XLS File) |
|
|||||
|
|||||
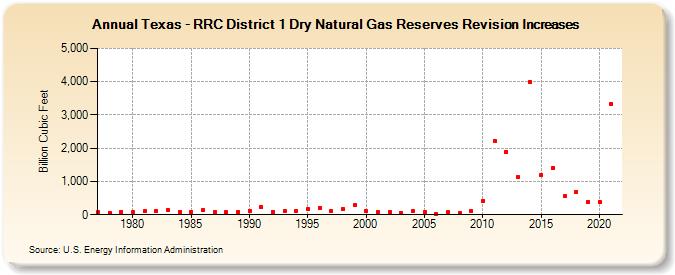
| Texas - RRC District 1 Dry Natural Gas Reserves Revision Increases (Billion Cubic Feet) | |||||
| Decade | Year-0 | Year-1 | Year-2 | Year-3 | Year-4 | Year-5 | Year-6 | Year-7 | Year-8 | Year-9 |
|---|---|---|---|---|---|---|---|---|---|---|
| 1970's | 77 | 64 | 67 | |||||||
| 1980's | 74 | 103 | 112 | 143 | 90 | 87 | 129 | 74 | 77 | 93 |
| 1990's | 125 | 225 | 95 | 117 | 114 | 171 | 211 | 118 | 174 | 287 |
| 2000's | 107 | 87 | 91 | 59 | 111 | 70 | 36 | 71 | 41 | 105 |
| 2010's | 424 | 2,221 | 1,896 | 1,141 | 4,001 | 1,194 | 1,413 | 553 | 690 | 380 |
| 2020's | 392 | 3,339 |
| - = No Data Reported; -- = Not Applicable; NA = Not Available; W = Withheld to avoid disclosure of individual company data. |
| Release Date: 12/30/2022 |
| Next Release Date: NA |