|
Download Data (XLS File) |
|
|||||
|
|||||
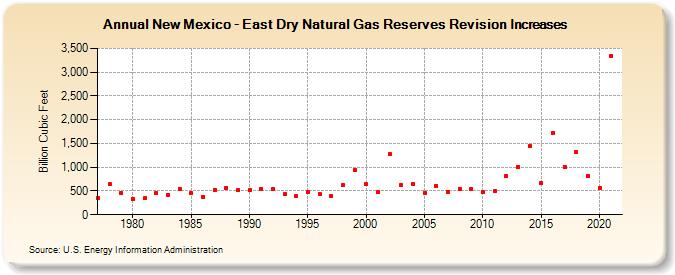
| New Mexico - East Dry Natural Gas Reserves Revision Increases (Billion Cubic Feet) | |||||
| Decade | Year-0 | Year-1 | Year-2 | Year-3 | Year-4 | Year-5 | Year-6 | Year-7 | Year-8 | Year-9 |
|---|---|---|---|---|---|---|---|---|---|---|
| 1970's | 362 | 636 | 455 | |||||||
| 1980's | 331 | 346 | 458 | 421 | 551 | 461 | 378 | 524 | 567 | 514 |
| 1990's | 512 | 550 | 532 | 430 | 385 | 476 | 440 | 392 | 623 | 938 |
| 2000's | 641 | 470 | 1,271 | 622 | 646 | 457 | 607 | 488 | 549 | 541 |
| 2010's | 480 | 502 | 814 | 1,014 | 1,442 | 663 | 1,718 | 1,010 | 1,310 | 811 |
| 2020's | 566 | 3,340 |
| - = No Data Reported; -- = Not Applicable; NA = Not Available; W = Withheld to avoid disclosure of individual company data. |
| Release Date: 12/30/2022 |
| Next Release Date: NA |