|
Download Data (XLS File) |
|
|||||
|
|||||
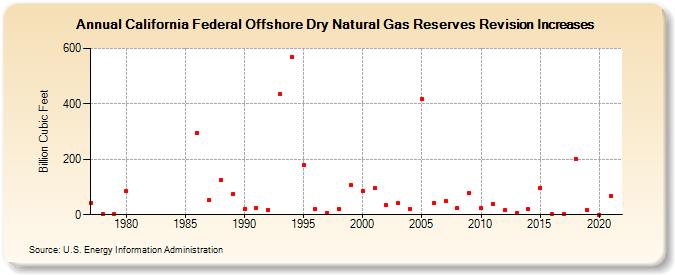
| California Federal Offshore Dry Natural Gas Reserves Revision Increases (Billion Cubic Feet) | |||||
| Decade | Year-0 | Year-1 | Year-2 | Year-3 | Year-4 | Year-5 | Year-6 | Year-7 | Year-8 | Year-9 |
|---|---|---|---|---|---|---|---|---|---|---|
| 1970's | 42 | 1 | 4 | |||||||
| 1980's | 84 | 296 | 53 | 124 | 74 | |||||
| 1990's | 19 | 24 | 18 | 435 | 569 | 180 | 19 | 6 | 19 | 107 |
| 2000's | 86 | 95 | 35 | 41 | 22 | 418 | 43 | 49 | 23 | 79 |
| 2010's | 23 | 39 | 16 | 6 | 19 | 98 | 3 | 2 | 202 | 16 |
| 2020's | 0 | 69 |
| - = No Data Reported; -- = Not Applicable; NA = Not Available; W = Withheld to avoid disclosure of individual company data. |
| Release Date: 12/30/2022 |
| Next Release Date: NA |