|
Download Data (XLS File) |
|
|||||
|
|||||
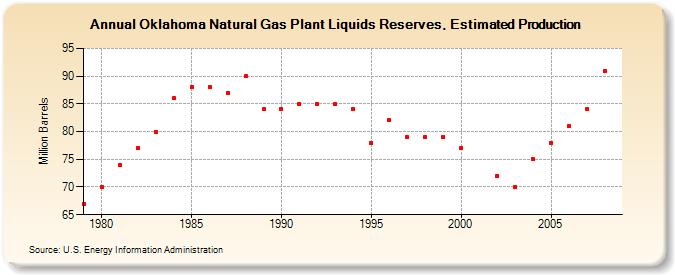
| Oklahoma Natural Gas Plant Liquids Reserves, Estimated Production (Million Barrels) | |||||
| Decade | Year-0 | Year-1 | Year-2 | Year-3 | Year-4 | Year-5 | Year-6 | Year-7 | Year-8 | Year-9 |
|---|---|---|---|---|---|---|---|---|---|---|
| 1970's | 67 | |||||||||
| 1980's | 70 | 74 | 77 | 80 | 86 | 88 | 88 | 87 | 90 | 84 |
| 1990's | 84 | 85 | 85 | 85 | 84 | 78 | 82 | 79 | 79 | 79 |
| 2000's | 77 | 72 | 70 | 75 | 78 | 81 | 84 | 91 |
| - = No Data Reported; -- = Not Applicable; NA = Not Available; W = Withheld to avoid disclosure of individual company data. |
| Release Date: 12/30/2022 |
| Next Release Date: NA |