|
Download Data (XLS File) |
|
|||||
|
|||||
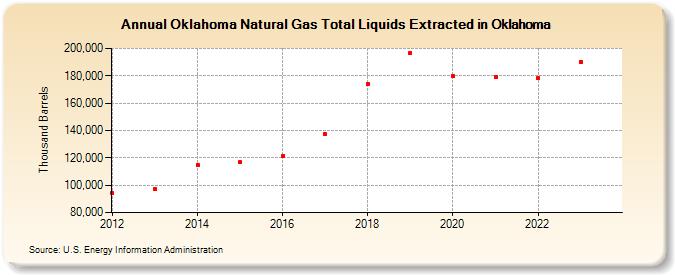
| Oklahoma Natural Gas Total Liquids Extracted in Oklahoma (Thousand Barrels) | |||||
| Decade | Year-0 | Year-1 | Year-2 | Year-3 | Year-4 | Year-5 | Year-6 | Year-7 | Year-8 | Year-9 |
|---|---|---|---|---|---|---|---|---|---|---|
| 2010's | 94,041 | 96,858 | 115,020 | 116,601 | 121,678 | 137,127 | 173,845 | 196,645 | ||
| 2020's | 179,801 | 179,377 | 178,308 | 190,467 | 182,532 |
| - = No Data Reported; -- = Not Applicable; NA = Not Available; W = Withheld to avoid disclosure of individual company data. |
| Release Date: 5/29/2026 |
| Next Release Date: 6/30/2026 |