|
Download Data (XLS File) |
|
|||||
|
|||||
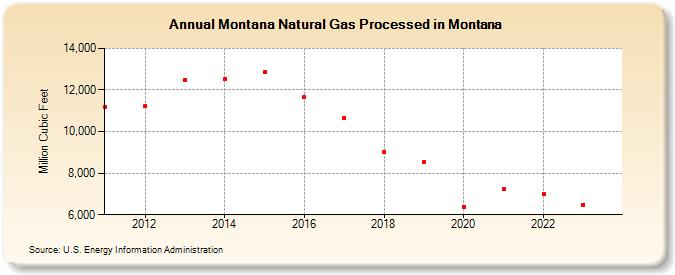
| Montana Natural Gas Processed in Montana (Million Cubic Feet) | |||||
| Decade | Year-0 | Year-1 | Year-2 | Year-3 | Year-4 | Year-5 | Year-6 | Year-7 | Year-8 | Year-9 |
|---|---|---|---|---|---|---|---|---|---|---|
| 2010's | 11,185 | 11,206 | 12,493 | 12,507 | 12,862 | 11,657 | 10,664 | 9,032 | 8,546 | |
| 2020's | 6,353 | 7,253 | 7,005 | 6,483 | 5,900 |
| - = No Data Reported; -- = Not Applicable; NA = Not Available; W = Withheld to avoid disclosure of individual company data. |
| Release Date: 6/30/2026 |
| Next Release Date: 7/31/2026 |
Referring Pages: