|
Download Data (XLS File) |
|
|||||
|
|||||
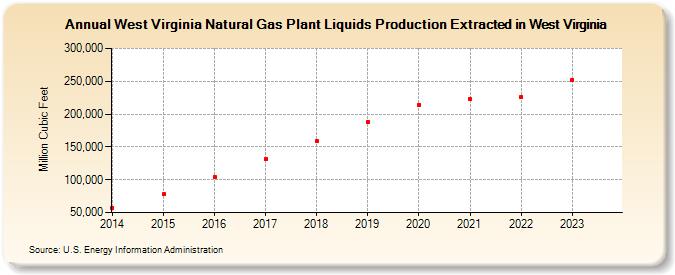
| West Virginia Natural Gas Plant Liquids Production Extracted in West Virginia (Million Cubic Feet) | |||||
| Decade | Year-0 | Year-1 | Year-2 | Year-3 | Year-4 | Year-5 | Year-6 | Year-7 | Year-8 | Year-9 |
|---|---|---|---|---|---|---|---|---|---|---|
| 2010's | 57,582 | 77,539 | 104,251 | 131,441 | 158,937 | 188,135 | ||||
| 2020's | 214,284 | 222,759 | 225,932 | 252,254 | 305,494 |
| - = No Data Reported; -- = Not Applicable; NA = Not Available; W = Withheld to avoid disclosure of individual company data. |
| Release Date: 6/30/2026 |
| Next Release Date: 7/31/2026 |