|
Download Data (XLS File) |
|
||||||||
|
||||||||
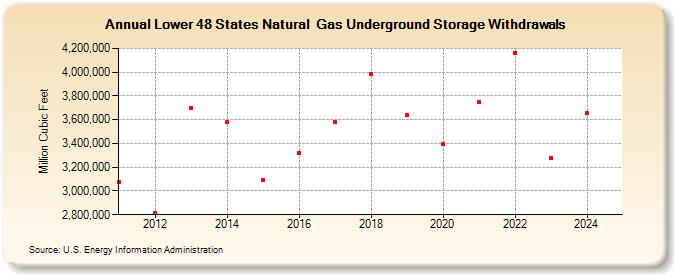
| Lower 48 States Natural Gas Underground Storage Withdrawals (Million Cubic Feet) | ||||||||
| Decade | Year-0 | Year-1 | Year-2 | Year-3 | Year-4 | Year-5 | Year-6 | Year-7 | Year-8 | Year-9 |
|---|---|---|---|---|---|---|---|---|---|---|
| 2010's | 3,074,251 | 2,818,148 | 3,694,251 | 3,579,344 | 3,089,746 | 3,318,510 | 3,579,109 | 3,988,330 | 3,637,415 | |
| 2020's | 3,396,639 | 3,747,370 | 4,163,978 | 3,282,686 | 3,655,253 | 4,119,105 |
| - = No Data Reported; -- = Not Applicable; NA = Not Available; W = Withheld to avoid disclosure of individual company data. |
| Release Date: 6/30/2026 |
| Next Release Date: 7/31/2026 |