|
Download Data (XLS File) |
|
|||||
|
|||||
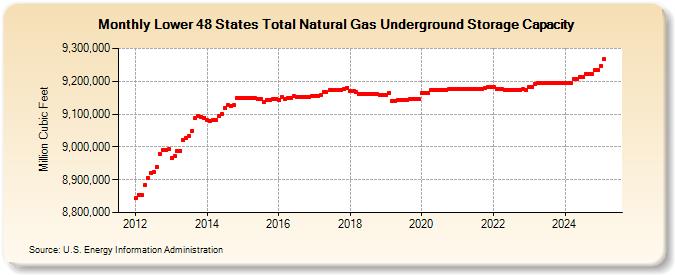
| Lower 48 States Total Natural Gas Underground Storage Capacity (Million Cubic Feet) | |||||
| Year | Jan | Feb | Mar | Apr | May | Jun | Jul | Aug | Sep | Oct | Nov | Dec |
|---|---|---|---|---|---|---|---|---|---|---|---|---|
| 2012 | 8,842,950 | 8,854,720 | 8,854,720 | 8,882,728 | 8,905,843 | 8,919,139 | 8,922,097 | 8,940,010 | 8,979,317 | 8,991,571 | 8,990,535 | 8,992,535 |
| 2013 | 8,965,468 | 8,971,280 | 8,986,201 | 8,988,916 | 9,020,589 | 9,027,650 | 9,033,704 | 9,048,658 | 9,087,425 | 9,093,741 | 9,090,861 | 9,089,358 |
| 2014 | 9,081,309 | 9,080,229 | 9,080,862 | 9,080,910 | 9,092,938 | 9,101,548 | 9,118,798 | 9,126,641 | 9,123,033 | 9,126,313 | 9,149,877 | 9,149,759 |
| 2015 | 9,149,550 | 9,148,736 | 9,149,449 | 9,149,506 | 9,147,410 | 9,147,181 | 9,147,181 | 9,138,181 | 9,143,012 | 9,144,086 | 9,144,919 | 9,147,248 |
| 2016 | 9,141,535 | 9,151,540 | 9,145,301 | 9,148,713 | 9,149,345 | 9,153,617 | 9,152,429 | 9,152,429 | 9,152,409 | 9,152,305 | 9,152,351 | 9,155,450 |
| 2017 | 9,156,307 | 9,156,307 | 9,156,585 | 9,167,823 | 9,167,823 | 9,172,552 | 9,172,239 | 9,174,599 | 9,174,170 | 9,174,128 | 9,177,498 | 9,180,536 |
| 2018 | 9,171,371 | 9,170,803 | 9,167,604 | 9,162,592 | 9,162,490 | 9,160,625 | 9,161,125 | 9,161,125 | 9,161,125 | 9,160,895 | 9,156,658 | 9,156,950 |
| 2019 | 9,158,041 | 9,165,144 | 9,140,764 | 9,138,561 | 9,142,587 | 9,143,287 | 9,143,181 | 9,144,281 | 9,145,410 | 9,146,154 | 9,146,204 | 9,146,100 |
| 2020 | 9,163,734 | 9,163,700 | 9,163,663 | 9,173,102 | 9,173,374 | 9,173,339 | 9,173,292 | 9,173,268 | 9,173,234 | 9,175,197 | 9,175,856 | 9,175,899 |
| 2021 | 9,175,899 | 9,175,863 | 9,175,863 | 9,175,796 | 9,175,762 | 9,175,727 | 9,175,693 | 9,175,693 | 9,176,844 | 9,177,883 | 9,181,461 | 9,181,274 |
| 2022 | 9,181,162 | 9,175,520 | 9,175,520 | 9,175,322 | 9,172,299 | 9,173,406 | 9,173,371 | 9,173,336 | 9,173,311 | 9,173,930 | 9,175,532 | 9,174,269 |
| 2023 | 9,182,963 | 9,182,962 | 9,191,303 | 9,194,745 | 9,195,720 | 9,195,190 | 9,194,856 | 9,194,820 | 9,194,788 | 9,194,486 | 9,194,653 | 9,194,631 |
| 2024 | 9,195,099 | 9,195,078 | 9,195,513 | 9,207,189 | 9,207,904 | 9,211,871 | 9,211,815 | 9,223,181 | 9,223,069 | 9,223,235 | 9,234,065 | 9,234,031 |
| 2025 | 9,246,786 | 9,266,755 | 9,266,721 | 9,266,689 | 9,266,655 | 9,266,990 | 9,274,755 | 9,279,129 | 9,279,199 | 9,283,856 | 9,283,816 | 9,285,036 |
| 2026 | 9,283,906 | 9,281,782 | 9,282,741 | 9,284,018 | ||||||||
| - = No Data Reported; -- = Not Applicable; NA = Not Available; W = Withheld to avoid disclosure of individual company data. |
| Release Date: 6/30/2026 |
| Next Release Date: 7/31/2026 |