|
Download Data (XLS File) |
|
||||||||
|
||||||||
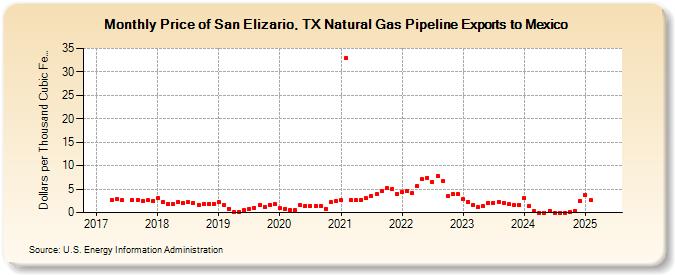
| Price of San Elizario, TX Natural Gas Pipeline Exports to Mexico (Dollars per Thousand Cubic Feet) | ||||||||
| Year | Jan | Feb | Mar | Apr | May | Jun | Jul | Aug | Sep | Oct | Nov | Dec |
|---|---|---|---|---|---|---|---|---|---|---|---|---|
| 2017 | 2.66 | 2.81 | 2.66 | 2.69 | 2.69 | 2.51 | 2.62 | 2.54 | ||||
| 2018 | 3.06 | 2.25 | 1.87 | 1.86 | 2.23 | 2.00 | 2.20 | 2.00 | 1.70 | 1.85 | 1.88 | 1.93 |
| 2019 | 2.16 | 1.54 | 0.83 | 0.11 | 0.12 | 0.51 | 0.83 | 1.06 | 1.63 | 1.25 | 1.69 | 1.72 |
| 2020 | 0.90 | 0.76 | 0.45 | 0.45 | 1.54 | 1.48 | 1.41 | 1.41 | 1.47 | 0.79 | 2.20 | 2.46 |
| 2021 | 2.62 | 32.97 | 2.59 | 2.58 | 2.76 | 3.00 | 3.61 | 3.88 | 4.49 | 5.13 | 5.07 | 3.98 |
| 2022 | 4.28 | 4.64 | 4.15 | 5.65 | 7.08 | 7.37 | 6.48 | 7.81 | 6.64 | 3.43 | 3.93 | 3.89 |
| 2023 | 3.03 | 2.48 | 1.70 | 1.25 | 1.54 | 2.21 | 2.29 | 2.46 | 2.27 | 1.91 | 1.74 | 1.86 |
| 2024 | 3.15 | 1.37 | 0.26 | 0.00 | 0.00 | 0.43 | 0.00 | 0.00 | 0.00 | 0.18 | 0.30 | 2.48 |
| 2025 | 3.77 | 2.64 | 0.43 | 1.29 | 1.00 | 1.93 | 1.95 | 1.20 | 0.00 | 0.00 | 0.22 | 0.00 |
| 2026 | 2.14 | 0.00 | 0.00 | 0.00 | ||||||||
| - = No Data Reported; -- = Not Applicable; NA = Not Available; W = Withheld to avoid disclosure of individual company data. |
| Release Date: 6/30/2026 |
| Next Release Date: 7/31/2026 |