|
Download Data (XLS File) |
|
||||||||
|
||||||||
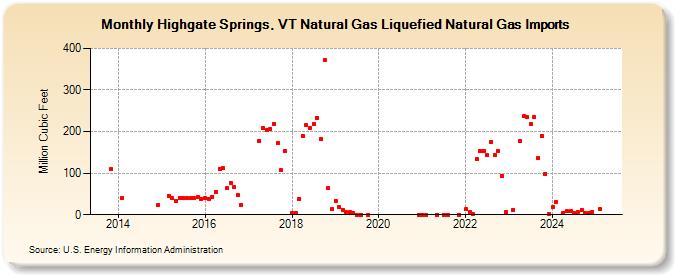
| Highgate Springs, VT Natural Gas Liquefied Natural Gas Imports (Million Cubic Feet) | ||||||||
| Year | Jan | Feb | Mar | Apr | May | Jun | Jul | Aug | Sep | Oct | Nov | Dec |
|---|---|---|---|---|---|---|---|---|---|---|---|---|
| 2013 | 109 | |||||||||||
| 2014 | 41 | 23 | ||||||||||
| 2015 | 46 | 39 | 34 | 41 | 41 | 39 | 40 | 41 | 43 | 37 | ||
| 2016 | 41 | 38 | 43 | 55 | 110 | 112 | 64 | 77 | 66 | 47 | 23 | |
| 2017 | 178 | 208 | 204 | 206 | 219 | 172 | 107 | 153 | ||||
| 2018 | 5 | 5 | 38 | 189 | 216 | 208 | 218 | 232 | 181 | 371 | 64 | 13 |
| 2019 | 34 | 18 | 12 | 6 | 6 | 3 | 0 | 0 | 0 | |||
| 2020 | 0 | |||||||||||
| 2021 | 0 | 0 | 0 | 0 | 0 | 0 | ||||||
| 2022 | 13 | 6 | 1 | 134 | 154 | 154 | 143 | 175 | 143 | 153 | 94 | 6 |
| 2023 | 12 | 178 | 237 | 234 | 219 | 235 | 137 | 190 | 99 | 1 | ||
| 2024 | 18 | 31 | 5 | 8 | 8 | 5 | 6 | 12 | 5 | 3 | 7 | |
| 2025 | 14 | 2 | 1 | 4 | 10 | 13 | 7 | 7 | 14 | 1 | 44 | |
| 2026 | 67 | 46 | 3 | |||||||||
| - = No Data Reported; -- = Not Applicable; NA = Not Available; W = Withheld to avoid disclosure of individual company data. |
| Release Date: 6/30/2026 |
| Next Release Date: 7/31/2026 |