|
Download Data (XLS File) |
|
||||||||
|
||||||||
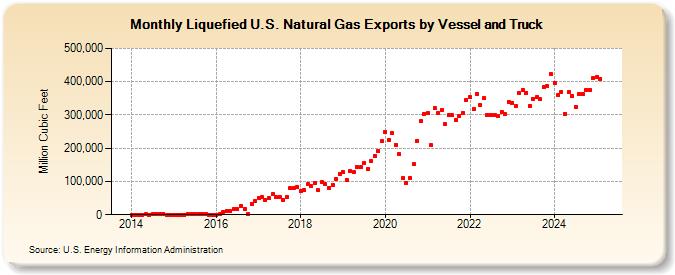
| Liquefied U.S. Natural Gas Exports by Vessel and Truck (Million Cubic Feet) | ||||||||
| Year | Jan | Feb | Mar | Apr | May | Jun | Jul | Aug | Sep | Oct | Nov | Dec |
|---|---|---|---|---|---|---|---|---|---|---|---|---|
| 2014 | 29 | 30 | 28 | 25 | 1,907 | 17 | 2,827 | 2,863 | 2,904 | 2,904 | 27 | 28 |
| 2015 | 27 | 20 | 23 | 24 | 2,769 | 2,774 | 2,771 | 2,763 | 2,767 | 2,769 | 21 | 27 |
| 2016 | 26 | 2,019 | 9,532 | 10,036 | 9,874 | 16,445 | 15,739 | 26,014 | 16,764 | 3,000 | 32,976 | 41,825 |
| 2017 | 51,342 | 52,042 | 43,553 | 50,669 | 60,782 | 52,462 | 53,592 | 45,468 | 54,733 | 79,773 | 80,100 | 82,604 |
| 2018 | 72,463 | 73,684 | 91,542 | 85,684 | 94,797 | 73,535 | 98,240 | 91,526 | 81,381 | 89,886 | 107,585 | 122,795 |
| 2019 | 126,957 | 102,866 | 130,814 | 127,102 | 144,913 | 141,956 | 156,865 | 138,578 | 160,274 | 177,966 | 190,610 | 220,498 |
| 2020 | 249,695 | 225,786 | 244,269 | 210,466 | 182,438 | 109,002 | 96,200 | 110,298 | 151,128 | 222,717 | 280,682 | 304,263 |
| 2021 | 305,196 | 208,394 | 321,023 | 306,818 | 314,922 | 271,368 | 300,143 | 298,262 | 284,813 | 298,119 | 306,397 | 345,363 |
| 2022 | 353,791 | 316,766 | 364,116 | 330,463 | 351,448 | 300,659 | 300,415 | 300,215 | 295,379 | 309,823 | 302,608 | 339,960 |
| 2023 | 337,155 | 326,275 | 366,552 | 375,843 | 366,774 | 327,872 | 349,292 | 353,059 | 346,604 | 384,403 | 386,262 | 422,935 |
| 2024 | 396,260 | 358,956 | 369,898 | 303,776 | 367,723 | 356,423 | 323,873 | 363,574 | 363,030 | 376,200 | 376,065 | 410,786 |
| 2025 | 414,951 | 409,232 | 457,660 | 448,242 | 435,298 | 406,036 | 436,840 | 451,139 | 451,755 | 503,475 | 525,089 | 569,267 |
| 2026 | 539,203 | 493,617 | 573,479 | 537,936 | ||||||||
| - = No Data Reported; -- = Not Applicable; NA = Not Available; W = Withheld to avoid disclosure of individual company data. |
| Release Date: 6/30/2026 |
| Next Release Date: 7/31/2026 |
Referring Pages: