|
Download Data (XLS File) |
|
||||||||
|
||||||||
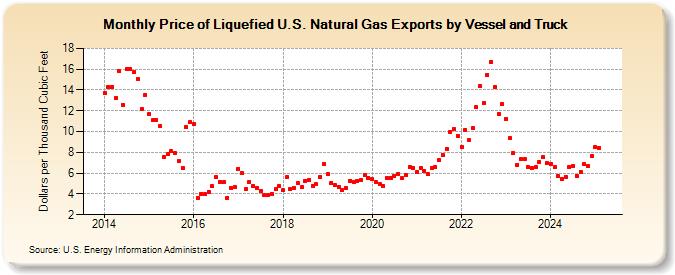
| Price of Liquefied U.S. Natural Gas Exports by Vessel and Truck (Dollars per Thousand Cubic Feet) | ||||||||
| Year | Jan | Feb | Mar | Apr | May | Jun | Jul | Aug | Sep | Oct | Nov | Dec |
|---|---|---|---|---|---|---|---|---|---|---|---|---|
| 2014 | 13.70 | 14.29 | 14.31 | 13.23 | 15.78 | 12.58 | 16.01 | 16.01 | 15.74 | 15.10 | 12.17 | 13.50 |
| 2015 | 11.71 | 11.08 | 11.10 | 10.53 | 7.53 | 7.82 | 8.10 | 7.91 | 7.17 | 6.53 | 10.45 | 10.90 |
| 2016 | 10.74 | 3.63 | 4.02 | 3.96 | 4.21 | 4.72 | 5.63 | 5.14 | 5.11 | 3.65 | 4.58 | 4.68 |
| 2017 | 6.44 | 5.99 | 4.47 | 5.16 | 4.80 | 4.61 | 4.26 | 3.88 | 3.88 | 4.02 | 4.47 | 4.74 |
| 2018 | 4.34 | 5.62 | 4.45 | 4.56 | 5.03 | 4.65 | 5.28 | 5.33 | 4.78 | 4.92 | 5.62 | 6.84 |
| 2019 | 5.89 | 5.06 | 4.84 | 4.70 | 4.39 | 4.57 | 5.29 | 5.13 | 5.28 | 5.31 | 5.84 | 5.55 |
| 2020 | 5.41 | 5.12 | 4.91 | 4.74 | 5.53 | 5.55 | 5.73 | 5.93 | 5.53 | 5.80 | 6.58 | 6.48 |
| 2021 | 6.08 | 6.52 | 6.25 | 5.92 | 6.46 | 6.57 | 7.23 | 7.75 | 8.34 | 9.98 | 10.24 | 9.62 |
| 2022 | 8.56 | 10.17 | 9.15 | 10.33 | 12.33 | 14.36 | 12.76 | 15.45 | 16.72 | 14.32 | 11.68 | 12.67 |
| 2023 | 11.24 | 9.36 | 7.97 | 6.83 | 7.33 | 7.37 | 6.62 | 6.45 | 6.57 | 7.08 | 7.51 | 6.94 |
| 2024 | 6.89 | 6.56 | 5.69 | 5.46 | 5.63 | 6.57 | 6.72 | 5.77 | 6.09 | 6.86 | 6.70 | 7.67 |
| 2025 | 8.51 | 8.43 | 8.89 | 8.44 | 7.42 | 7.62 | 7.60 | 7.51 | 7.09 | 7.34 | 7.69 | 8.46 |
| 2026 | 8.67 | 11.33 | 7.57 | 8.03 | ||||||||
| - = No Data Reported; -- = Not Applicable; NA = Not Available; W = Withheld to avoid disclosure of individual company data. |
| Release Date: 6/30/2026 |
| Next Release Date: 7/31/2026 |
Referring Pages: