|
Download Data (XLS File) |
|
||||||||
|
||||||||
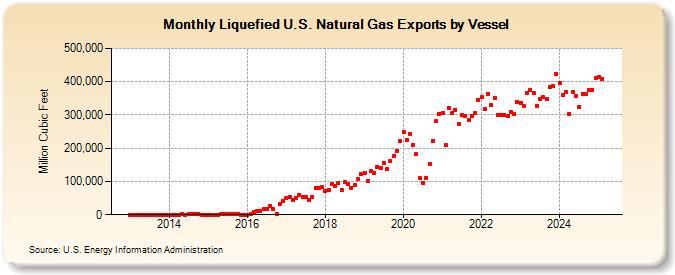
| Liquefied U.S. Natural Gas Exports by Vessel (Million Cubic Feet) | ||||||||
| Year | Jan | Feb | Mar | Apr | May | Jun | Jul | Aug | Sep | Oct | Nov | Dec |
|---|---|---|---|---|---|---|---|---|---|---|---|---|
| 2013 | 0 | 0 | 0 | 0 | 0 | 0 | 0 | 0 | 0 | 0 | 0 | 0 |
| 2014 | 0 | 0 | 0 | 0 | 1,886 | 0 | 2,809 | 2,846 | 2,886 | 2,884 | 0 | 0 |
| 2015 | 0 | 0 | 0 | 0 | 2,748 | 2,754 | 2,753 | 2,753 | 2,755 | 2,755 | 0 | 0 |
| 2016 | 0 | 1,995 | 9,507 | 10,013 | 9,841 | 16,423 | 15,711 | 25,984 | 16,729 | 2,957 | 32,928 | 41,784 |
| 2017 | 51,257 | 51,998 | 43,489 | 50,599 | 60,756 | 52,443 | 53,548 | 45,435 | 54,679 | 79,708 | 80,013 | 82,499 |
| 2018 | 72,358 | 73,613 | 91,486 | 85,680 | 94,791 | 73,518 | 98,213 | 91,493 | 81,361 | 89,855 | 107,470 | 122,673 |
| 2019 | 126,854 | 102,817 | 130,741 | 126,795 | 144,837 | 141,864 | 156,764 | 138,465 | 160,169 | 177,813 | 190,523 | 220,247 |
| 2020 | 249,571 | 225,699 | 244,145 | 210,443 | 182,420 | 108,941 | 96,128 | 110,220 | 151,055 | 222,650 | 280,630 | 304,209 |
| 2021 | 305,113 | 208,331 | 321,004 | 306,755 | 314,855 | 271,256 | 300,030 | 298,097 | 284,645 | 297,929 | 306,229 | 345,195 |
| 2022 | 353,631 | 316,605 | 363,971 | 330,326 | 351,325 | 300,546 | 300,339 | 300,112 | 295,285 | 309,629 | 302,455 | 339,792 |
| 2023 | 337,022 | 326,169 | 366,450 | 375,779 | 366,742 | 327,821 | 349,258 | 353,031 | 346,553 | 384,376 | 386,229 | 422,908 |
| 2024 | 396,240 | 358,942 | 369,885 | 303,754 | 367,695 | 356,399 | 323,853 | 363,559 | 363,017 | 376,200 | 376,045 | 410,776 |
| 2025 | 414,951 | 409,181 | 457,660 | 448,223 | 435,289 | 406,028 | 436,824 | 451,130 | 451,735 | 503,456 | 525,089 | 569,254 |
| 2026 | 539,203 | 493,617 | 573,479 | 537,936 | ||||||||
| - = No Data Reported; -- = Not Applicable; NA = Not Available; W = Withheld to avoid disclosure of individual company data. |
| Release Date: 6/30/2026 |
| Next Release Date: 7/31/2026 |
Referring Pages: