|
Download Data (XLS File) |
|
||||||||
|
||||||||
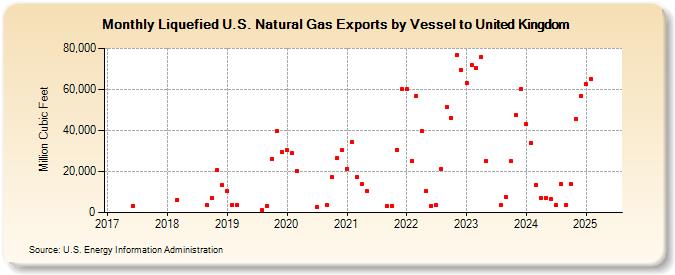
| Liquefied U.S. Natural Gas Exports by Vessel to United Kingdom (Million Cubic Feet) | ||||||||
| Year | Jan | Feb | Mar | Apr | May | Jun | Jul | Aug | Sep | Oct | Nov | Dec |
|---|---|---|---|---|---|---|---|---|---|---|---|---|
| 2017 | 3,410 | |||||||||||
| 2018 | 6,267 | 3,624 | 7,213 | 20,695 | 13,499 | |||||||
| 2019 | 10,373 | 3,711 | 3,669 | 1,335 | 3,303 | 26,260 | 39,957 | 29,749 | ||||
| 2020 | 30,428 | 28,884 | 20,202 | 2,908 | 3,664 | 17,191 | 26,544 | 30,378 | ||||
| 2021 | 21,436 | 34,343 | 17,440 | 13,877 | 10,586 | 3,099 | 3,302 | 30,648 | 60,315 | |||
| 2022 | 60,060 | 25,301 | 56,799 | 39,775 | 10,608 | 3,326 | 3,797 | 21,263 | 51,467 | 46,040 | 76,693 | 69,332 |
| 2023 | 63,032 | 71,702 | 70,499 | 75,836 | 25,242 | 3,655 | 7,464 | 24,900 | 47,642 | 60,209 | ||
| 2024 | 42,928 | 34,117 | 13,663 | 6,887 | 7,100 | 6,398 | 3,703 | 13,891 | 3,575 | 13,835 | 45,444 | 56,998 |
| 2025 | 62,503 | 68,675 | 38,489 | 10,462 | 7,207 | 7,222 | 3,615 | 13,947 | 32,428 | 60,301 | 67,364 | |
| 2026 | 92,297 | 60,432 | 21,799 | 6,380 | ||||||||
| - = No Data Reported; -- = Not Applicable; NA = Not Available; W = Withheld to avoid disclosure of individual company data. |
| Release Date: 6/30/2026 |
| Next Release Date: 7/31/2026 |
Referring Pages: