|
Download Data (XLS File) |
|
||||||||
|
||||||||
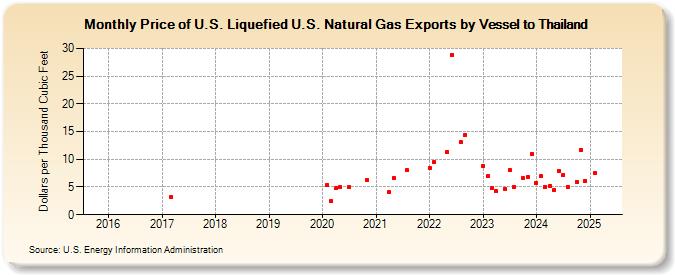
| Price of U.S. Liquefied U.S. Natural Gas Exports by Vessel to Thailand (Dollars per Thousand Cubic Feet) | ||||||||
| Year | Jan | Feb | Mar | Apr | May | Jun | Jul | Aug | Sep | Oct | Nov | Dec |
|---|---|---|---|---|---|---|---|---|---|---|---|---|
| 2016 | -- | -- | -- | -- | -- | -- | -- | -- | -- | -- | -- | -- |
| 2017 | -- | -- | 3.14 | -- | -- | -- | -- | -- | -- | -- | -- | -- |
| 2018 | -- | -- | -- | -- | -- | -- | -- | -- | -- | -- | -- | -- |
| 2019 | -- | -- | -- | -- | W | -- | -- | -- | W | -- | -- | -- |
| 2020 | -- | 5.37 | 2.44 | 4.77 | 5.04 | -- | 4.91 | -- | -- | -- | 6.22 | -- |
| 2021 | -- | -- | -- | 4.08 | 6.66 | -- | -- | 7.99 | -- | -- | -- | -- |
| 2022 | 8.49 | 9.49 | -- | -- | 11.35 | 28.89 | -- | 13.05 | 14.30 | -- | -- | -- |
| 2023 | 8.75 | 6.93 | 4.77 | 4.22 | -- | 4.65 | 8.05 | 5.05 | -- | 6.65 | 6.82 | 10.99 |
| 2024 | 5.75 | 6.93 | 5.07 | 5.26 | 4.54 | 7.95 | 7.09 | 5.04 | -- | 5.99 | 11.75 | 6.15 |
| 2025 | -- | 7.44 | 7.32 | 7.77 | 7.61 | -- | 8.25 | 5.72 | -- | 5.51 | 6.07 | 7.40 |
| 2026 | -- | 11.74 | 5.91 | 7.61 | ||||||||
| - = No Data Reported; -- = Not Applicable; NA = Not Available; W = Withheld to avoid disclosure of individual company data. |
| Release Date: 6/30/2026 |
| Next Release Date: 7/31/2026 |
Referring Pages: