|
Download Data (XLS File) |
|
||||||||
|
||||||||
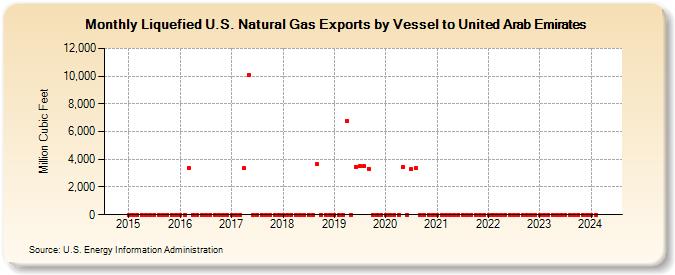
| Liquefied U.S. Natural Gas Exports by Vessel to United Arab Emirates (Million Cubic Feet) | ||||||||
| Year | Jan | Feb | Mar | Apr | May | Jun | Jul | Aug | Sep | Oct | Nov | Dec |
|---|---|---|---|---|---|---|---|---|---|---|---|---|
| 2015 | 0 | 0 | 0 | 0 | 0 | 0 | 0 | 0 | 0 | 0 | 0 | 0 |
| 2016 | 0 | 0 | 3,391 | 0 | 0 | 0 | 0 | 0 | 0 | 0 | 0 | 0 |
| 2017 | 0 | 0 | 0 | 3,347 | 10,062 | 0 | 0 | 0 | 0 | 0 | 0 | 0 |
| 2018 | 0 | 0 | 0 | 0 | 0 | 0 | 0 | 0 | 3,638 | 0 | 0 | 0 |
| 2019 | 0 | 0 | 0 | 6,787 | 0 | 3,459 | 3,487 | 3,502 | 3,325 | 0 | 0 | 0 |
| 2020 | 0 | 0 | 0 | 0 | 3,474 | 0 | 3,277 | 3,359 | 0 | 0 | 0 | 0 |
| 2021 | 0 | 0 | 0 | 0 | 0 | 0 | 0 | 0 | 0 | 0 | 0 | 0 |
| 2022 | 0 | 0 | 0 | 0 | 0 | 0 | 0 | 0 | 0 | 0 | 0 | 0 |
| 2023 | 0 | 0 | 0 | 0 | 0 | 0 | 0 | 0 | 0 | 0 | 0 | 0 |
| 2024 | 0 | 0 | 0 | 0 | 3,064 | 0 | 0 | 0 | 0 | 0 | 0 | 0 |
| 2025 | 0 | 0 | 3,690 | 3,557 | 0 | 0 | 0 | 0 | 2,145 | 0 | 0 | 0 |
| 2026 | 0 | 0 | 0 | |||||||||
| - = No Data Reported; -- = Not Applicable; NA = Not Available; W = Withheld to avoid disclosure of individual company data. |
| Release Date: 5/29/2026 |
| Next Release Date: 6/30/2026 |
Referring Pages: