|
Download Data (XLS File) |
|
||||||||
|
||||||||
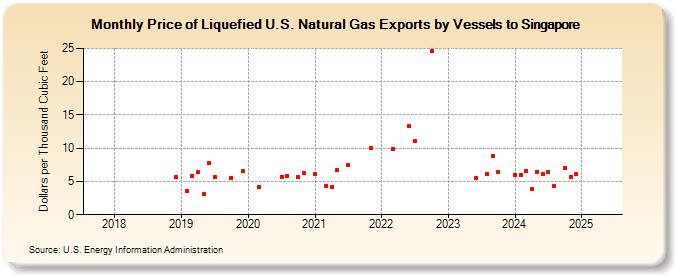
| Price of Liquefied U.S. Natural Gas Exports by Vessels to Singapore (Dollars per Thousand Cubic Feet) | ||||||||
| Year | Jan | Feb | Mar | Apr | May | Jun | Jul | Aug | Sep | Oct | Nov | Dec |
|---|---|---|---|---|---|---|---|---|---|---|---|---|
| 2018 | -- | -- | -- | -- | -- | -- | -- | -- | -- | -- | -- | 5.63 |
| 2019 | -- | 3.52 | 5.86 | 6.36 | 3.07 | 7.75 | 5.60 | -- | -- | 5.58 | -- | 6.60 |
| 2020 | -- | -- | 4.18 | -- | -- | -- | 5.71 | 5.88 | -- | 5.63 | 6.29 | -- |
| 2021 | 6.11 | -- | 4.37 | 4.12 | 6.67 | -- | 7.42 | -- | -- | -- | 10.03 | -- |
| 2022 | -- | -- | 9.92 | -- | -- | 13.31 | 11.07 | -- | -- | 24.54 | -- | -- |
| 2023 | -- | -- | -- | -- | -- | 5.46 | -- | 6.17 | 8.86 | 6.49 | -- | -- |
| 2024 | 6.04 | 5.95 | 6.62 | 3.93 | 6.48 | 6.19 | 6.40 | 4.26 | -- | 6.96 | 5.72 | 6.15 |
| 2025 | -- | -- | -- | -- | 7.00 | -- | -- | 7.45 | -- | 6.61 | -- | -- |
| 2026 | -- | -- | 6.31 | 6.63 | ||||||||
| - = No Data Reported; -- = Not Applicable; NA = Not Available; W = Withheld to avoid disclosure of individual company data. |
| Release Date: 6/30/2026 |
| Next Release Date: 7/31/2026 |
Referring Pages: