|
Download Data (XLS File) |
|
||||||||
|
||||||||
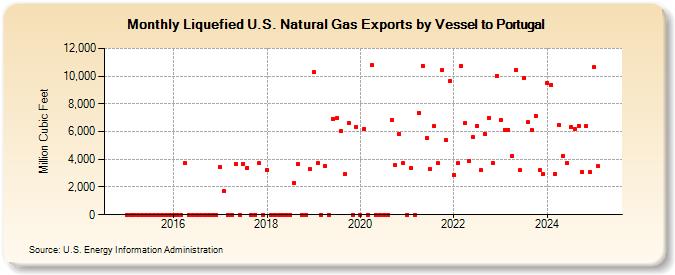
| Liquefied U.S. Natural Gas Exports by Vessel to Portugal (Million Cubic Feet) | ||||||||
| Year | Jan | Feb | Mar | Apr | May | Jun | Jul | Aug | Sep | Oct | Nov | Dec |
|---|---|---|---|---|---|---|---|---|---|---|---|---|
| 2015 | 0 | 0 | 0 | 0 | 0 | 0 | 0 | 0 | 0 | 0 | 0 | 0 |
| 2016 | 0 | 0 | 0 | 3,700 | 0 | 0 | 0 | 0 | 0 | 0 | 0 | 0 |
| 2017 | 3,442 | 1,692 | 0 | 0 | 3,625 | 0 | 3,662 | 3,399 | 0 | 0 | 3,702 | 0 |
| 2018 | 3,247 | 0 | 0 | 0 | 0 | 0 | 0 | 2,296 | 3,670 | 0 | 0 | 3,298 |
| 2019 | 10,289 | 3,720 | 0 | 3,489 | 0 | 6,908 | 6,994 | 6,051 | 2,924 | 6,621 | 0 | 6,345 |
| 2020 | 0 | 6,187 | 0 | 10,777 | 0 | 0 | 0 | 0 | 6,853 | 3,564 | 5,830 | 3,711 |
| 2021 | 0 | 3,360 | 0 | 7,358 | 10,765 | 5,538 | 3,296 | 6,382 | 3,696 | 10,459 | 5,380 | 9,630 |
| 2022 | 2,868 | 3,703 | 10,728 | 6,632 | 3,888 | 5,582 | 6,412 | 3,202 | 5,806 | 7,005 | 3,732 | 10,025 |
| 2023 | 6,816 | 6,138 | 6,133 | 4,237 | 10,424 | 3,194 | 9,845 | 6,660 | 6,135 | 7,125 | 3,204 | 2,945 |
| 2024 | 9,503 | 9,384 | 2,932 | 6,469 | 4,238 | 3,743 | 6,314 | 6,188 | 6,435 | 3,070 | 6,386 | 3,068 |
| 2025 | 10,626 | 3,492 | 3,579 | 3,491 | 3,499 | 6,649 | 3,279 | 10,871 | 10,822 | 3,499 | 3,504 | 3,508 |
| 2026 | 3,212 | 7,073 | 7,573 | 6,762 | ||||||||
| - = No Data Reported; -- = Not Applicable; NA = Not Available; W = Withheld to avoid disclosure of individual company data. |
| Release Date: 6/30/2026 |
| Next Release Date: 7/31/2026 |
Referring Pages: