|
Download Data (XLS File) |
|
||||||||
|
||||||||
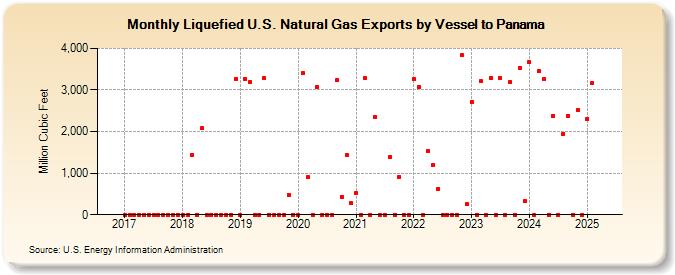
| Liquefied U.S. Natural Gas Exports by Vessel to Panama (Million Cubic Feet) | ||||||||
| Year | Jan | Feb | Mar | Apr | May | Jun | Jul | Aug | Sep | Oct | Nov | Dec |
|---|---|---|---|---|---|---|---|---|---|---|---|---|
| 2017 | 0 | 0 | 0 | 0 | 0 | 0 | 0 | 0 | 0 | 0 | 0 | 0 |
| 2018 | 0 | 0 | 1,442 | 0 | 2,077 | 0 | 0 | 0 | 0 | 0 | 0 | 3,268 |
| 2019 | 0 | 3,269 | 3,191 | 0 | 0 | 3,282 | 0 | 0 | 0 | 0 | 478 | 0 |
| 2020 | 0 | 3,408 | 906 | 0 | 3,070 | 0 | 0 | 0 | 3,228 | 433 | 1,448 | 271 |
| 2021 | 516 | 0 | 3,279 | 0 | 2,341 | 0 | 0 | 1,390 | 0 | 911 | 0 | 0 |
| 2022 | 3,255 | 3,069 | 0 | 1,536 | 1,192 | 623 | 0 | 0 | 0 | 0 | 3,833 | 249 |
| 2023 | 2,718 | 0 | 3,209 | 0 | 3,289 | 0 | 3,295 | 0 | 3,196 | 0 | 3,530 | 328 |
| 2024 | 3,677 | 0 | 3,448 | 3,265 | 0 | 2,375 | 0 | 1,945 | 2,382 | 0 | 2,518 | 0 |
| 2025 | 2,315 | 3,165 | 3,618 | 3,070 | 1,438 | 1,975 | 1,367 | 3,028 | 0 | 3,674 | 0 | 0 |
| 2026 | 3,342 | 2,707 | 0 | 3,407 | ||||||||
| - = No Data Reported; -- = Not Applicable; NA = Not Available; W = Withheld to avoid disclosure of individual company data. |
| Release Date: 6/30/2026 |
| Next Release Date: 7/31/2026 |
Referring Pages: