|
Download Data (XLS File) |
|
||||||||
|
||||||||
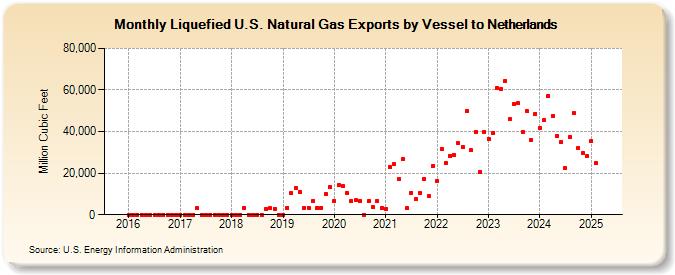
| Liquefied U.S. Natural Gas Exports by Vessel to Netherlands (Million Cubic Feet) | ||||||||
| Year | Jan | Feb | Mar | Apr | May | Jun | Jul | Aug | Sep | Oct | Nov | Dec |
|---|---|---|---|---|---|---|---|---|---|---|---|---|
| 2016 | 0 | 0 | 0 | 0 | 0 | 0 | 0 | 0 | 0 | 0 | 0 | 0 |
| 2017 | 0 | 0 | 0 | 0 | 3,042 | 0 | 0 | 0 | 0 | 0 | 0 | 0 |
| 2018 | 0 | 0 | 0 | 3,253 | 0 | 0 | 0 | 0 | 2,915 | 3,071 | 2,949 | 0 |
| 2019 | 0 | 3,390 | 10,452 | 13,010 | 10,734 | 3,310 | 3,386 | 6,688 | 3,431 | 3,456 | 10,099 | 13,405 |
| 2020 | 6,681 | 14,099 | 13,772 | 10,305 | 6,826 | 6,870 | 6,746 | 0 | 6,671 | 3,603 | 6,684 | 3,316 |
| 2021 | 2,949 | 22,777 | 24,204 | 17,060 | 26,611 | 3,030 | 10,597 | 7,347 | 10,424 | 17,157 | 8,829 | 23,354 |
| 2022 | 16,279 | 31,591 | 24,922 | 28,395 | 28,902 | 34,420 | 32,637 | 50,020 | 30,924 | 39,703 | 20,645 | 39,893 |
| 2023 | 36,453 | 39,301 | 61,017 | 60,234 | 64,538 | 45,866 | 53,296 | 53,596 | 39,745 | 49,701 | 36,150 | 48,658 |
| 2024 | 41,873 | 45,501 | 57,169 | 47,486 | 37,694 | 34,890 | 22,461 | 37,494 | 48,864 | 32,221 | 29,842 | 28,274 |
| 2025 | 35,404 | 24,794 | 56,519 | 56,009 | 78,927 | 62,077 | 53,830 | 70,762 | 68,528 | 51,931 | 43,564 | 43,494 |
| 2026 | 39,137 | 56,798 | 57,969 | 54,061 | ||||||||
| - = No Data Reported; -- = Not Applicable; NA = Not Available; W = Withheld to avoid disclosure of individual company data. |
| Release Date: 6/30/2026 |
| Next Release Date: 7/31/2026 |
Referring Pages: