|
Download Data (XLS File) |
|
||||||||
|
||||||||
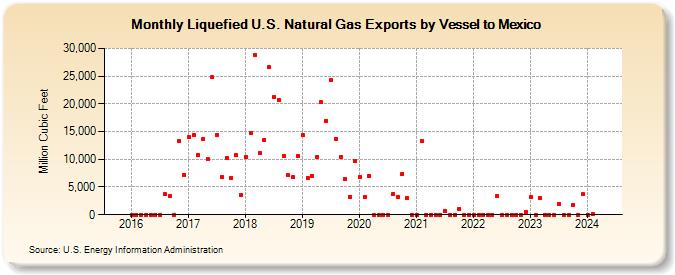
| Liquefied U.S. Natural Gas Exports by Vessel to Mexico (Million Cubic Feet) | ||||||||
| Year | Jan | Feb | Mar | Apr | May | Jun | Jul | Aug | Sep | Oct | Nov | Dec |
|---|---|---|---|---|---|---|---|---|---|---|---|---|
| 2016 | 0 | 0 | 0 | 0 | 0 | 0 | 0 | 3,686 | 3,315 | 0 | 13,300 | 7,169 |
| 2017 | 14,010 | 14,407 | 10,728 | 13,730 | 10,023 | 24,763 | 14,432 | 6,860 | 10,286 | 6,686 | 10,760 | 3,635 |
| 2018 | 10,431 | 14,777 | 28,877 | 11,074 | 13,512 | 26,591 | 21,237 | 20,708 | 10,559 | 7,076 | 6,794 | 10,610 |
| 2019 | 14,310 | 6,681 | 7,038 | 10,406 | 20,244 | 16,955 | 24,209 | 13,681 | 10,442 | 6,437 | 3,273 | 9,696 |
| 2020 | 6,764 | 3,167 | 7,037 | 0 | 0 | 0 | 0 | 3,701 | 3,285 | 7,398 | 3,056 | 0 |
| 2021 | 0 | 13,354 | 0 | 0 | 0 | 0 | 758 | 0 | 0 | 1,088 | 0 | 0 |
| 2022 | 0 | 0 | 0 | 0 | 0 | 3,292 | 0 | 0 | 0 | 0 | 0 | 539 |
| 2023 | 3,219 | 0 | 3,051 | 0 | 0 | 0 | 1,954 | 0 | 0 | 1,776 | 0 | 3,660 |
| 2024 | 2,602 | 87 | 0 | 0 | 3,190 | 33 | 0 | 751 | 0 | 2,550 | 0 | 1,986 |
| 2025 | 0 | 0 | 0 | 3,385 | 0 | 0 | 1,501 | 3,231 | 0 | 0 | 2,733 | 0 |
| 2026 | 0 | 0 | 3,032 | 0 | ||||||||
| - = No Data Reported; -- = Not Applicable; NA = Not Available; W = Withheld to avoid disclosure of individual company data. |
| Release Date: 6/30/2026 |
| Next Release Date: 7/31/2026 |
Referring Pages: