|
Download Data (XLS File) |
|
||||||||
|
||||||||
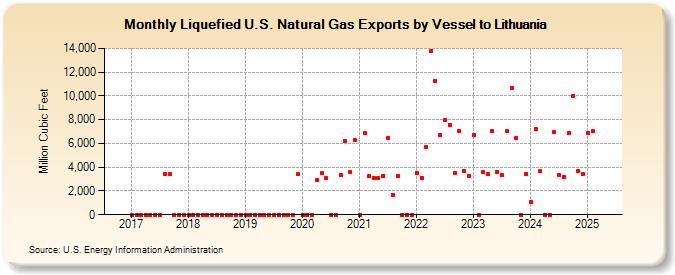
| Liquefied U.S. Natural Gas Exports by Vessel to Lithuania (Million Cubic Feet) | ||||||||
| Year | Jan | Feb | Mar | Apr | May | Jun | Jul | Aug | Sep | Oct | Nov | Dec |
|---|---|---|---|---|---|---|---|---|---|---|---|---|
| 2017 | 0 | 0 | 0 | 0 | 0 | 0 | 0 | 3,431 | 3,414 | 0 | 0 | 0 |
| 2018 | 0 | 0 | 0 | 0 | 0 | 0 | 0 | 0 | 0 | 0 | 0 | 0 |
| 2019 | 0 | 0 | 0 | 0 | 0 | 0 | 0 | 0 | 0 | 0 | 0 | 3,455 |
| 2020 | 0 | 0 | 0 | 2,945 | 3,473 | 3,049 | 0 | 0 | 3,308 | 6,191 | 3,621 | 6,291 |
| 2021 | 0 | 6,851 | 3,228 | 3,078 | 3,049 | 3,285 | 6,469 | 1,677 | 3,282 | 0 | 0 | 0 |
| 2022 | 3,518 | 3,131 | 5,700 | 13,770 | 11,237 | 6,729 | 7,947 | 7,579 | 3,541 | 7,072 | 3,708 | 3,281 |
| 2023 | 6,713 | 0 | 3,599 | 3,412 | 7,048 | 3,629 | 3,375 | 7,005 | 10,666 | 6,476 | 0 | 3,409 |
| 2024 | 1,083 | 7,174 | 3,641 | 0 | 0 | 6,938 | 3,334 | 3,208 | 6,878 | 9,983 | 3,682 | 3,391 |
| 2025 | 6,887 | 3,388 | 6,603 | 10,145 | 7,074 | 3,254 | 10,731 | 3,499 | 7,339 | 10,354 | 6,853 | 3,689 |
| 2026 | 7,861 | 7,289 | 3,537 | 0 | ||||||||
| - = No Data Reported; -- = Not Applicable; NA = Not Available; W = Withheld to avoid disclosure of individual company data. |
| Release Date: 6/30/2026 |
| Next Release Date: 7/31/2026 |
Referring Pages: