|
Download Data (XLS File) |
|
||||||||
|
||||||||
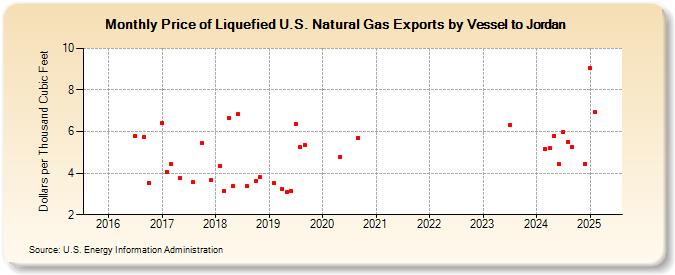
| Price of Liquefied U.S. Natural Gas Exports by Vessel to Jordan (Dollars per Thousand Cubic Feet) | ||||||||
| Year | Jan | Feb | Mar | Apr | May | Jun | Jul | Aug | Sep | Oct | Nov | Dec |
|---|---|---|---|---|---|---|---|---|---|---|---|---|
| 2016 | -- | -- | -- | -- | -- | -- | 5.81 | -- | 5.74 | 3.52 | -- | -- |
| 2017 | 6.41 | 4.06 | 4.42 | -- | 3.76 | -- | -- | 3.55 | -- | 5.45 | -- | 3.68 |
| 2018 | -- | 4.34 | 3.15 | 6.63 | 3.37 | 6.85 | -- | 3.38 | -- | 3.61 | 3.80 | -- |
| 2019 | -- | 3.52 | -- | 3.24 | 3.07 | 3.15 | 6.38 | 5.24 | 5.37 | -- | -- | -- |
| 2020 | -- | -- | -- | -- | 4.80 | -- | -- | -- | 5.71 | -- | -- | -- |
| 2021 | -- | -- | -- | -- | -- | -- | -- | -- | -- | -- | -- | -- |
| 2022 | -- | -- | -- | -- | -- | -- | -- | -- | -- | -- | -- | -- |
| 2023 | -- | -- | -- | -- | -- | -- | 6.31 | -- | -- | -- | -- | -- |
| 2024 | -- | -- | 5.14 | 5.20 | 5.78 | 4.42 | 5.98 | 5.51 | 5.28 | -- | -- | 4.45 |
| 2025 | 9.05 | 6.94 | 10.50 | 10.71 | -- | -- | -- | 10.77 | -- | 10.46 | -- | -- |
| 2026 | 8.05 | -- | -- | -- | ||||||||
| - = No Data Reported; -- = Not Applicable; NA = Not Available; W = Withheld to avoid disclosure of individual company data. |
| Release Date: 6/30/2026 |
| Next Release Date: 7/31/2026 |
Referring Pages: