|
Download Data (XLS File) |
|
||||||||
|
||||||||
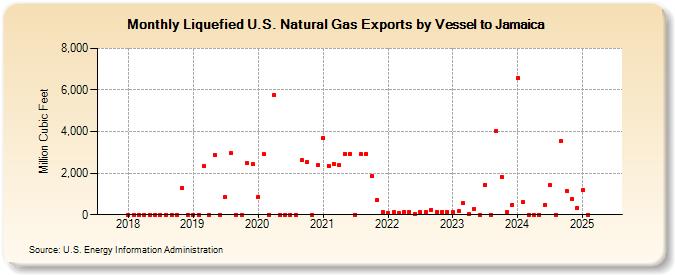
| Liquefied U.S. Natural Gas Exports by Vessel to Jamaica (Million Cubic Feet) | ||||||||
| Year | Jan | Feb | Mar | Apr | May | Jun | Jul | Aug | Sep | Oct | Nov | Dec |
|---|---|---|---|---|---|---|---|---|---|---|---|---|
| 2018 | 0 | 0 | 0 | 0 | 0 | 0 | 0 | 0 | 0 | 0 | 1,303 | 0 |
| 2019 | 0 | 0 | 2,320 | 0 | 2,890 | 0 | 837 | 2,946 | 0 | 0 | 2,464 | 2,435 |
| 2020 | 869 | 2,914 | 1 | 5,770 | 0 | 0 | 0 | 0 | 2,610 | 2,514 | 0 | 2,374 |
| 2021 | 3,708 | 2,365 | 2,458 | 2,370 | 2,925 | 2,927 | 0 | 2,907 | 2,931 | 1,858 | 715 | 113 |
| 2022 | 86 | 111 | 92 | 135 | 144 | 48 | 121 | 110 | 240 | 144 | 137 | 147 |
| 2023 | 107 | 161 | 540 | 31 | 289 | 3 | 1,443 | 3 | 4,038 | 1,831 | 122 | 480 |
| 2024 | 4,945 | 590 | 3 | 3 | 3 | 475 | 1,409 | 1 | 3,523 | 1,146 | 776 | 327 |
| 2025 | 1,200 | 0 | 0 | 0 | 0 | 0 | 273 | 0 | 0 | 0 | 2,033 | 0 |
| 2026 | 72 | 3,606 | 1,058 | 258 | ||||||||
| - = No Data Reported; -- = Not Applicable; NA = Not Available; W = Withheld to avoid disclosure of individual company data. |
| Release Date: 6/30/2026 |
| Next Release Date: 7/31/2026 |
Referring Pages: