|
Download Data (XLS File) |
|
||||||||
|
||||||||
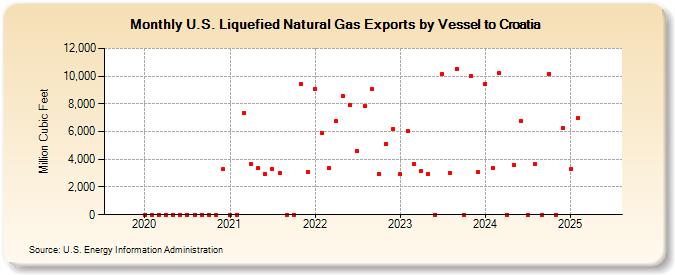
| U.S. Liquefied Natural Gas Exports by Vessel to Croatia (Million Cubic Feet) | ||||||||
| Year | Jan | Feb | Mar | Apr | May | Jun | Jul | Aug | Sep | Oct | Nov | Dec |
|---|---|---|---|---|---|---|---|---|---|---|---|---|
| 2020 | 0 | 0 | 0 | 0 | 0 | 0 | 0 | 0 | 0 | 0 | 0 | 3,275 |
| 2021 | 0 | 0 | 7,367 | 3,666 | 3,364 | 2,923 | 3,299 | 2,980 | 0 | 0 | 9,416 | 3,117 |
| 2022 | 9,084 | 5,870 | 3,358 | 6,763 | 8,543 | 7,925 | 4,600 | 7,824 | 9,073 | 2,922 | 5,122 | 6,204 |
| 2023 | 2,913 | 6,006 | 3,694 | 3,163 | 2,932 | 0 | 10,121 | 3,023 | 10,542 | 0 | 9,995 | 3,050 |
| 2024 | 9,464 | 3,377 | 10,202 | 0 | 3,570 | 6,784 | 0 | 3,654 | 0 | 10,186 | 0 | 6,241 |
| 2025 | 3,279 | 6,993 | 0 | 6,780 | 3,719 | 3,666 | 6,240 | 0 | 3,704 | 5,742 | 6,941 | 10,704 |
| 2026 | 9,908 | 6,831 | 3,057 | 6,959 | ||||||||
| - = No Data Reported; -- = Not Applicable; NA = Not Available; W = Withheld to avoid disclosure of individual company data. |
| Release Date: 6/30/2026 |
| Next Release Date: 7/31/2026 |
Referring Pages: