|
Download Data (XLS File) |
|
||||||||
|
||||||||
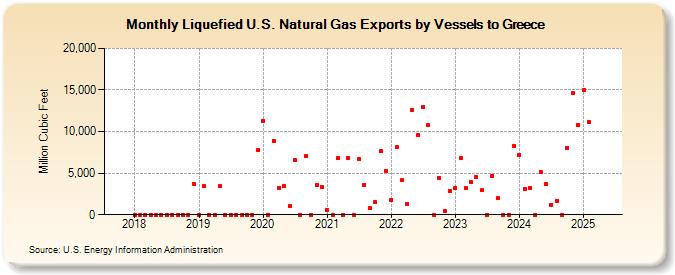
| Liquefied U.S. Natural Gas Exports by Vessels to Greece (Million Cubic Feet) | ||||||||
| Year | Jan | Feb | Mar | Apr | May | Jun | Jul | Aug | Sep | Oct | Nov | Dec |
|---|---|---|---|---|---|---|---|---|---|---|---|---|
| 2018 | 0 | 0 | 0 | 0 | 0 | 0 | 0 | 0 | 0 | 0 | 0 | 3,722 |
| 2019 | 0 | 3,394 | 0 | 0 | 3,497 | 0 | 0 | 0 | 0 | 0 | 0 | 7,752 |
| 2020 | 11,276 | 0 | 8,892 | 3,233 | 3,430 | 1,076 | 6,544 | 0 | 7,027 | 0 | 3,543 | 3,382 |
| 2021 | 600 | 0 | 6,805 | 0 | 6,796 | 0 | 6,651 | 3,607 | 799 | 1,515 | 7,629 | 5,305 |
| 2022 | 1,802 | 8,094 | 4,116 | 1,336 | 12,650 | 9,633 | 12,922 | 10,763 | 0 | 4,424 | 421 | 2,869 |
| 2023 | 3,207 | 6,781 | 3,156 | 3,905 | 4,498 | 2,924 | 0 | 4,700 | 1,968 | 0 | 0 | 8,287 |
| 2024 | 7,153 | 3,136 | 3,240 | 0 | 5,182 | 3,702 | 1,208 | 1,651 | 0 | 8,048 | 14,633 | 10,794 |
| 2025 | 15,032 | 11,131 | 0 | 3,639 | 4,157 | 10,363 | 11,550 | 3,514 | 6,822 | 11,010 | 10,540 | 11,982 |
| 2026 | 11,679 | 14,178 | 9,777 | |||||||||
| - = No Data Reported; -- = Not Applicable; NA = Not Available; W = Withheld to avoid disclosure of individual company data. |
| Release Date: 5/29/2026 |
| Next Release Date: 6/30/2026 |
Referring Pages: