|
Download Data (XLS File) |
|
||||||||
|
||||||||
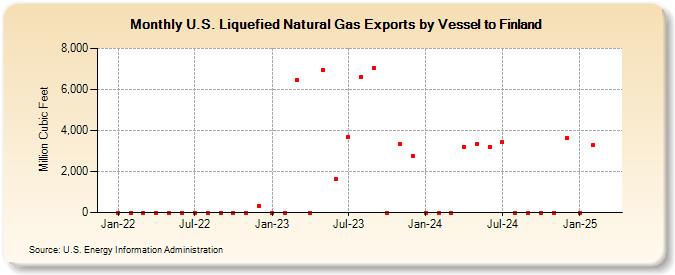
| U.S. Liquefied Natural Gas Exports by Vessel to Finland (Million Cubic Feet) | ||||||||
| Year | Jan | Feb | Mar | Apr | May | Jun | Jul | Aug | Sep | Oct | Nov | Dec |
|---|---|---|---|---|---|---|---|---|---|---|---|---|
| 2022 | 0 | 0 | 0 | 0 | 0 | 0 | 0 | 0 | 0 | 0 | 0 | 329 |
| 2023 | 0 | 0 | 6,462 | 0 | 6,935 | 1,622 | 3,666 | 6,630 | 7,057 | 0 | 3,335 | 2,762 |
| 2024 | 0 | 0 | 0 | 3,215 | 3,321 | 3,212 | 3,432 | 0 | 0 | 0 | 0 | 3,655 |
| 2025 | 0 | 3,296 | 0 | 3,359 | 6,599 | 6,469 | 3,618 | 0 | 7,329 | 0 | 3,565 | 0 |
| 2026 | 0 | 0 | 3,643 | 3,496 | ||||||||
| - = No Data Reported; -- = Not Applicable; NA = Not Available; W = Withheld to avoid disclosure of individual company data. |
| Release Date: 6/30/2026 |
| Next Release Date: 7/31/2026 |
Referring Pages: