|
Download Data (XLS File) |
|
||||||||
|
||||||||
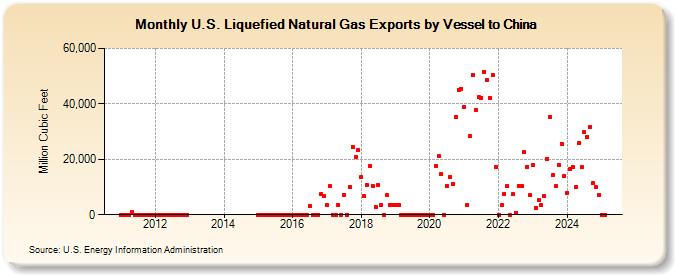
| U.S. Liquefied Natural Gas Exports by Vessel to China (Million Cubic Feet) | ||||||||
| Year | Jan | Feb | Mar | Apr | May | Jun | Jul | Aug | Sep | Oct | Nov | Dec |
|---|---|---|---|---|---|---|---|---|---|---|---|---|
| 2011 | 0 | 0 | 0 | 0 | 1,127 | 0 | 0 | 0 | 0 | 0 | 0 | 0 |
| 2012 | 0 | 0 | 0 | 0 | 0 | 0 | 0 | 0 | 0 | 0 | 0 | 0 |
| 2015 | 0 | 0 | 0 | 0 | 0 | 0 | 0 | 0 | 0 | 0 | 0 | 0 |
| 2016 | 0 | 0 | 0 | 0 | 0 | 0 | 3,132 | 0 | 0 | 0 | 7,341 | 6,747 |
| 2017 | 3,391 | 10,338 | 0 | 0 | 3,514 | 0 | 7,218 | 0 | 10,056 | 24,588 | 20,871 | 23,433 |
| 2018 | 13,584 | 6,750 | 10,739 | 17,509 | 10,416 | 2,926 | 10,644 | 3,588 | 0 | 7,269 | 3,451 | 3,598 |
| 2019 | 3,387 | 3,464 | 0 | 0 | 0 | 0 | 0 | 0 | 0 | 0 | 0 | 0 |
| 2020 | 0 | 0 | 17,699 | 21,140 | 14,535 | 0 | 10,358 | 13,699 | 11,245 | 35,115 | 45,083 | 45,525 |
| 2021 | 38,940 | 3,415 | 28,476 | 50,474 | 37,731 | 42,319 | 42,222 | 51,662 | 48,584 | 42,202 | 50,228 | 17,050 |
| 2022 | 0 | 3,357 | 7,527 | 10,217 | 0 | 7,329 | 784 | 10,272 | 10,275 | 22,598 | 17,308 | 6,992 |
| 2023 | 17,896 | 2,565 | 5,132 | 3,426 | 6,593 | 20,261 | 35,337 | 14,252 | 10,222 | 18,013 | 25,601 | 13,949 |
| 2024 | 7,944 | 16,312 | 17,376 | 10,025 | 25,863 | 17,042 | 29,700 | 28,150 | 31,621 | 11,448 | 10,113 | 7,244 |
| 2025 | 0 | 0 | 0 | 0 | 0 | 0 | 0 | 0 | 546 | 0 | 0 | 0 |
| 2026 | 0 | 509 | 0 | |||||||||
| - = No Data Reported; -- = Not Applicable; NA = Not Available; W = Withheld to avoid disclosure of individual company data. |
| Release Date: 5/29/2026 |
| Next Release Date: 6/30/2026 |
Referring Pages: