|
Download Data (XLS File) |
|
||||||||
|
||||||||
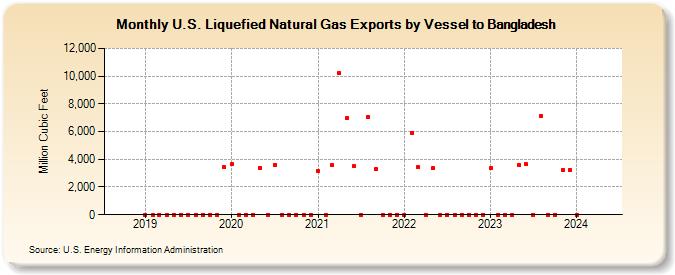
| U.S. Liquefied Natural Gas Exports by Vessel to Bangladesh (Million Cubic Feet) | ||||||||
| Year | Jan | Feb | Mar | Apr | May | Jun | Jul | Aug | Sep | Oct | Nov | Dec |
|---|---|---|---|---|---|---|---|---|---|---|---|---|
| 2019 | 0 | 0 | 0 | 0 | 0 | 0 | 0 | 0 | 0 | 0 | 0 | 3,419 |
| 2020 | 3,640 | 0 | 0 | 0 | 3,406 | 0 | 3,614 | 0 | 0 | 0 | 0 | 0 |
| 2021 | 3,148 | 0 | 3,566 | 10,219 | 6,948 | 3,493 | 0 | 7,085 | 3,276 | 0 | 0 | 0 |
| 2022 | 0 | 5,896 | 3,421 | 0 | 3,346 | 0 | 0 | 0 | 0 | 0 | 0 | 0 |
| 2023 | 3,369 | 0 | 0 | 0 | 3,561 | 3,624 | 0 | 7,095 | 0 | 0 | 3,240 | 3,257 |
| 2024 | 0 | 0 | 3,281 | 3,289 | 0 | 3,294 | 0 | 0 | 6,328 | 10,291 | 7,108 | 6,585 |
| 2025 | 3,395 | 3,500 | 0 | 7,146 | 3,531 | 13,697 | 6,940 | 3,553 | 13,236 | 3,453 | 0 | 0 |
| 2026 | 0 | 6,642 | 13,461 | 7,248 | ||||||||
| - = No Data Reported; -- = Not Applicable; NA = Not Available; W = Withheld to avoid disclosure of individual company data. |
| Release Date: 6/30/2026 |
| Next Release Date: 7/31/2026 |
Referring Pages: