|
Download Data (XLS File) |
|
||||||||
|
||||||||
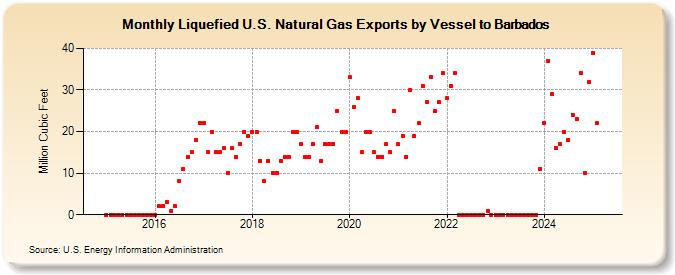
| Liquefied U.S. Natural Gas Exports by Vessel to Barbados (Million Cubic Feet) | ||||||||
| Year | Jan | Feb | Mar | Apr | May | Jun | Jul | Aug | Sep | Oct | Nov | Dec |
|---|---|---|---|---|---|---|---|---|---|---|---|---|
| 2015 | 0 | 0 | 0 | 0 | 0 | 0 | 0 | 0 | 0 | 0 | 0 | 0 |
| 2016 | 0 | 2 | 2 | 3 | 1 | 2 | 8 | 11 | 14 | 15 | 18 | 22 |
| 2017 | 22 | 15 | 20 | 15 | 15 | 16 | 10 | 16 | 14 | 17 | 20 | 19 |
| 2018 | 20 | 20 | 13 | 8 | 13 | 10 | 10 | 13 | 14 | 14 | 20 | 20 |
| 2019 | 17 | 14 | 14 | 17 | 21 | 13 | 17 | 17 | 17 | 25 | 20 | 20 |
| 2020 | 33 | 26 | 28 | 15 | 20 | 20 | 15 | 14 | 14 | 17 | 15 | 25 |
| 2021 | 17 | 19 | 14 | 30 | 19 | 22 | 31 | 27 | 33 | 25 | 27 | 34 |
| 2022 | 28 | 31 | 34 | 0 | 0 | 0 | 0 | 0 | 0 | 0 | 1 | 0 |
| 2023 | 0 | 0 | 0 | 0 | 0 | 0 | 0 | 0 | 0 | 0 | 0 | 11 |
| 2024 | 22 | 37 | 29 | 16 | 17 | 20 | 18 | 24 | 23 | 34 | 10 | 32 |
| 2025 | 39 | 22 | 54 | 54 | 42 | 44 | 68 | 44 | 39 | 34 | 65 | 54 |
| 2026 | 56 | 50 | 54 | 59 | ||||||||
| - = No Data Reported; -- = Not Applicable; NA = Not Available; W = Withheld to avoid disclosure of individual company data. |
| Release Date: 6/30/2026 |
| Next Release Date: 7/31/2026 |
Referring Pages: