|
Download Data (XLS File) |
|
||||||||
|
||||||||
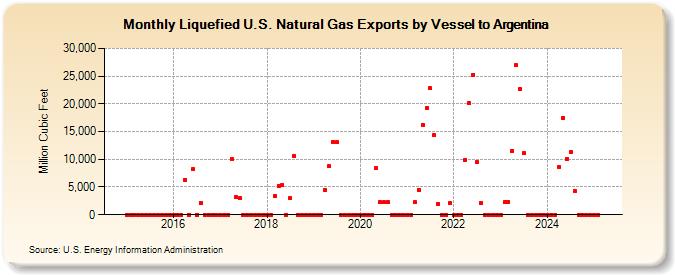
| Liquefied U.S. Natural Gas Exports by Vessel to Argentina (Million Cubic Feet) | ||||||||
| Year | Jan | Feb | Mar | Apr | May | Jun | Jul | Aug | Sep | Oct | Nov | Dec |
|---|---|---|---|---|---|---|---|---|---|---|---|---|
| 2015 | 0 | 0 | 0 | 0 | 0 | 0 | 0 | 0 | 0 | 0 | 0 | 0 |
| 2016 | 0 | 0 | 0 | 6,310 | 0 | 8,161 | 0 | 2,190 | 0 | 0 | 0 | 0 |
| 2017 | 0 | 0 | 0 | 10,135 | 3,192 | 2,949 | 0 | 0 | 0 | 0 | 0 | 0 |
| 2018 | 0 | 0 | 3,333 | 5,217 | 5,392 | 0 | 2,939 | 10,679 | 0 | 0 | 0 | 0 |
| 2019 | 0 | 0 | 0 | 4,369 | 8,737 | 13,120 | 13,066 | 0 | 0 | 0 | 0 | 0 |
| 2020 | 0 | 0 | 0 | 0 | 8,372 | 2,229 | 2,218 | 2,249 | 0 | 0 | 0 | 0 |
| 2021 | 0 | 0 | 2,238 | 4,485 | 16,226 | 19,312 | 22,798 | 14,363 | 1,950 | 0 | 0 | 2,077 |
| 2022 | 0 | 0 | 0 | 9,933 | 20,111 | 25,246 | 9,448 | 2,202 | 0 | 0 | 0 | 0 |
| 2023 | 0 | 2,287 | 2,343 | 11,536 | 26,930 | 22,663 | 11,162 | 0 | 0 | 0 | 0 | 0 |
| 2024 | 0 | 0 | 0 | 8,674 | 17,470 | 10,114 | 11,310 | 4,270 | 0 | 0 | 0 | 0 |
| 2025 | 0 | 0 | 0 | 2,129 | 2,285 | 10,419 | 10,535 | 0 | 0 | 0 | 0 | 0 |
| 2026 | 0 | 0 | 0 | 2,044 | ||||||||
| - = No Data Reported; -- = Not Applicable; NA = Not Available; W = Withheld to avoid disclosure of individual company data. |
| Release Date: 6/30/2026 |
| Next Release Date: 7/31/2026 |
Referring Pages: