|
Download Data (XLS File) |
|
||||||||
|
||||||||
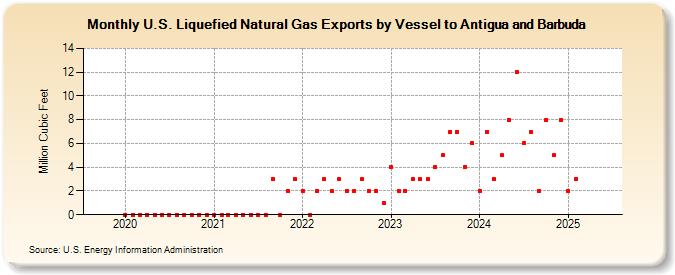
| U.S. Liquefied Natural Gas Exports by Vessel to Antigua and Barbuda (Million Cubic Feet) | ||||||||
| Year | Jan | Feb | Mar | Apr | May | Jun | Jul | Aug | Sep | Oct | Nov | Dec |
|---|---|---|---|---|---|---|---|---|---|---|---|---|
| 2020 | 0 | 0 | 0 | 0 | 0 | 0 | 0 | 0 | 0 | 0 | 0 | 0 |
| 2021 | 0 | 0 | 0 | 0 | 0 | 0 | 0 | 0 | 3 | 0 | 2 | 3 |
| 2022 | 2 | 0 | 2 | 3 | 2 | 3 | 2 | 2 | 3 | 2 | 2 | 1 |
| 2023 | 4 | 2 | 2 | 3 | 3 | 3 | 4 | 5 | 7 | 7 | 4 | 6 |
| 2024 | 2 | 7 | 3 | 5 | 8 | 12 | 6 | 7 | 2 | 8 | 5 | 8 |
| 2025 | 2 | 3 | 3 | 5 | 6 | 4 | 2 | 3 | 0 | 3 | 3 | 8 |
| 2026 | 0 | 4 | 3 | 2 | ||||||||
| - = No Data Reported; -- = Not Applicable; NA = Not Available; W = Withheld to avoid disclosure of individual company data. |
| Release Date: 6/30/2026 |
| Next Release Date: 7/31/2026 |
Referring Pages: