|
Download Data (XLS File) |
|
|||||
|
|||||
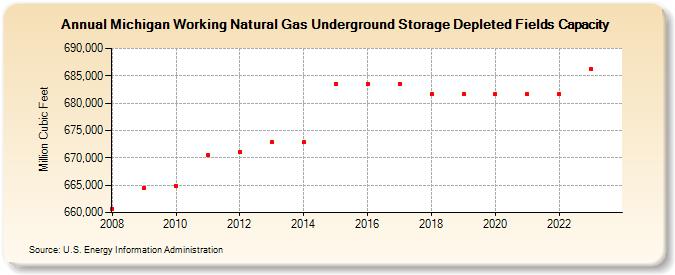
| Michigan Working Natural Gas Underground Storage Depleted Fields Capacity (Million Cubic Feet) | |||||
| Decade | Year-0 | Year-1 | Year-2 | Year-3 | Year-4 | Year-5 | Year-6 | Year-7 | Year-8 | Year-9 |
|---|---|---|---|---|---|---|---|---|---|---|
| 2000's | 660,693 | 664,486 | ||||||||
| 2010's | 664,906 | 670,473 | 671,041 | 672,808 | 672,844 | 683,567 | 683,567 | 683,549 | 681,660 | 681,660 |
| 2020's | 681,660 | 681,660 | 681,640 | 686,229 | 686,229 |
| - = No Data Reported; -- = Not Applicable; NA = Not Available; W = Withheld to avoid disclosure of individual company data. |
| Release Date: 6/30/2026 |
| Next Release Date: 7/31/2026 |