|
Download Data (XLS File) |
|
||||||||
|
||||||||
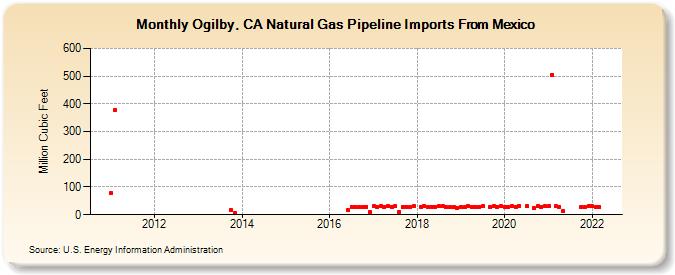
| Ogilby, CA Natural Gas Pipeline Imports From Mexico (Million Cubic Feet) | ||||||||
| Year | Jan | Feb | Mar | Apr | May | Jun | Jul | Aug | Sep | Oct | Nov | Dec |
|---|---|---|---|---|---|---|---|---|---|---|---|---|
| 2011 | 78 | 376 | ||||||||||
| 2013 | 16 | 7 | ||||||||||
| 2016 | 16 | 29 | 29 | 28 | 28 | 29 | 10 | |||||
| 2017 | 30 | 27 | 30 | 29 | 30 | 29 | 30 | 10 | 29 | 29 | 29 | 30 |
| 2018 | 27 | 30 | 29 | 29 | 28 | 30 | 30 | 27 | 28 | 28 | 26 | |
| 2019 | 29 | 27 | 30 | 29 | 29 | 29 | 30 | 29 | 30 | 29 | 30 | |
| 2020 | 28 | 28 | 30 | 29 | 30 | 30 | 25 | 30 | 29 | 30 | ||
| 2021 | 30 | 505 | 30 | 29 | 13 | 29 | 28 | 30 | ||||
| 2022 | 30 | 27 | 28 | |||||||||
| - = No Data Reported; -- = Not Applicable; NA = Not Available; W = Withheld to avoid disclosure of individual company data. |
| Release Date: 6/30/2026 |
| Next Release Date: 7/31/2026 |