|
Download Data (XLS File) |
|
||||||||
|
||||||||
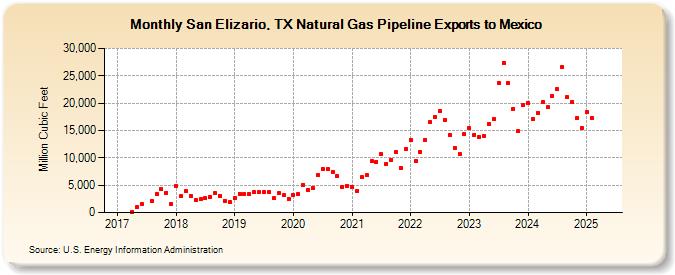
| San Elizario, TX Natural Gas Pipeline Exports to Mexico (Million Cubic Feet) | ||||||||
| Year | Jan | Feb | Mar | Apr | May | Jun | Jul | Aug | Sep | Oct | Nov | Dec |
|---|---|---|---|---|---|---|---|---|---|---|---|---|
| 2017 | 39 | 955 | 1,505 | 2,120 | 3,419 | 4,253 | 3,658 | 1,555 | ||||
| 2018 | 4,921 | 2,945 | 3,929 | 3,068 | 2,279 | 2,422 | 2,617 | 2,839 | 3,514 | 3,074 | 2,189 | 1,860 |
| 2019 | 2,669 | 3,479 | 3,359 | 3,419 | 3,700 | 3,674 | 3,707 | 3,749 | 2,618 | 3,534 | 3,126 | 2,484 |
| 2020 | 3,169 | 3,333 | 5,096 | 4,202 | 4,447 | 6,836 | 7,971 | 7,888 | 7,446 | 6,633 | 4,726 | 4,865 |
| 2021 | 4,656 | 4,015 | 6,450 | 6,804 | 9,410 | 9,319 | 10,612 | 8,885 | 9,655 | 11,032 | 8,164 | 11,650 |
| 2022 | 13,337 | 9,421 | 11,087 | 13,280 | 16,556 | 17,529 | 18,539 | 16,974 | 14,245 | 11,802 | 10,627 | 14,313 |
| 2023 | 15,390 | 14,232 | 13,889 | 14,062 | 16,161 | 17,130 | 23,739 | 27,402 | 23,716 | 18,924 | 14,824 | 19,603 |
| 2024 | 20,091 | 17,088 | 18,249 | 20,173 | 19,216 | 21,315 | 22,496 | 26,608 | 21,055 | 20,218 | 17,234 | 15,471 |
| 2025 | 18,436 | 17,338 | 18,215 | 19,289 | 22,193 | 21,067 | 22,008 | 23,535 | 21,904 | 19,267 | 15,248 | 18,747 |
| 2026 | 20,292 | 19,139 | 18,955 | 21,317 | ||||||||
| - = No Data Reported; -- = Not Applicable; NA = Not Available; W = Withheld to avoid disclosure of individual company data. |
| Release Date: 6/30/2026 |
| Next Release Date: 7/31/2026 |