|
Download Data (XLS File) |
|
|||||
|
|||||
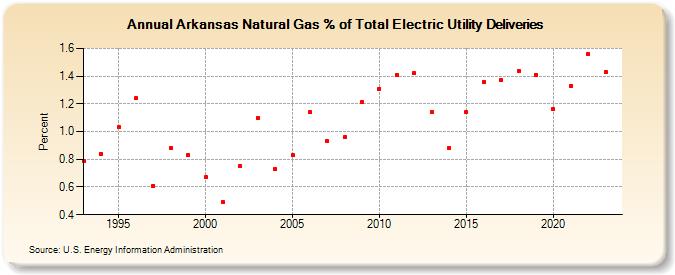
| Arkansas Natural Gas % of Total Electric Utility Deliveries (Percent) | |||||
| Decade | Year-0 | Year-1 | Year-2 | Year-3 | Year-4 | Year-5 | Year-6 | Year-7 | Year-8 | Year-9 |
|---|---|---|---|---|---|---|---|---|---|---|
| 1990's | 0.79 | 0.84 | 1.03 | 1.24 | 0.61 | 0.88 | 0.83 | |||
| 2000's | 0.67 | 0.49 | 0.75 | 1.10 | 0.73 | 0.83 | 1.14 | 0.93 | 0.96 | 1.21 |
| 2010's | 1.31 | 1.41 | 1.42 | 1.14 | 0.88 | 1.14 | 1.36 | 1.37 | 1.44 | 1.41 |
| 2020's | 1.16 | 1.33 | 1.56 | 1.48 | 1.37 |
| - = No Data Reported; -- = Not Applicable; NA = Not Available; W = Withheld to avoid disclosure of individual company data. |
| Release Date: 5/29/2026 |
| Next Release Date: 6/30/2026 |