|
Download Data (XLS File) |
|
|||||
|
|||||
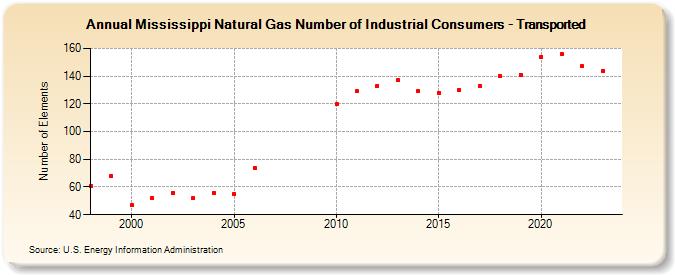
| Mississippi Natural Gas Number of Industrial Consumers - Transported (Number of Elements) | |||||
| Decade | Year-0 | Year-1 | Year-2 | Year-3 | Year-4 | Year-5 | Year-6 | Year-7 | Year-8 | Year-9 |
|---|---|---|---|---|---|---|---|---|---|---|
| 1990's | 61 | 68 | ||||||||
| 2000's | 47 | 52 | 56 | 52 | 56 | 55 | 74 | |||
| 2010's | 120 | 129 | 133 | 137 | 129 | 128 | 130 | 133 | 140 | 141 |
| 2020's | 154 | 156 | 147 | 144 | 149 |
| - = No Data Reported; -- = Not Applicable; NA = Not Available; W = Withheld to avoid disclosure of individual company data. |
| Release Date: 6/30/2026 |
| Next Release Date: 7/31/2026 |