|
Download Data (XLS File) |
|
|||||
|
|||||
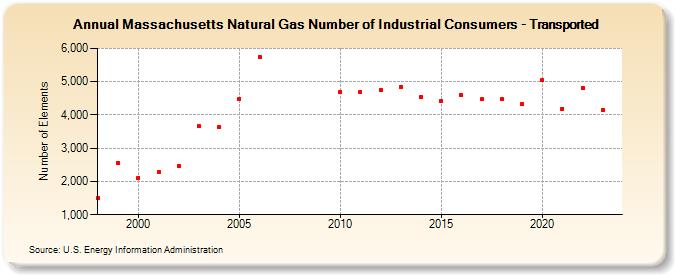
| Massachusetts Natural Gas Number of Industrial Consumers - Transported (Number of Elements) | |||||
| Decade | Year-0 | Year-1 | Year-2 | Year-3 | Year-4 | Year-5 | Year-6 | Year-7 | Year-8 | Year-9 |
|---|---|---|---|---|---|---|---|---|---|---|
| 1990's | 1,497 | 2,558 | ||||||||
| 2000's | 2,113 | 2,282 | 2,463 | 3,665 | 3,622 | 4,491 | 5,747 | |||
| 2010's | 4,701 | 4,690 | 4,760 | 4,844 | 4,550 | 4,410 | 4,594 | 4,468 | 4,477 | 4,339 |
| 2020's | 5,038 | 4,192 | 4,819 | 4,145 | 3,876 |
| - = No Data Reported; -- = Not Applicable; NA = Not Available; W = Withheld to avoid disclosure of individual company data. |
| Release Date: 6/30/2026 |
| Next Release Date: 7/31/2026 |