|
Download Data (XLS File) |
|
|||||
|
|||||
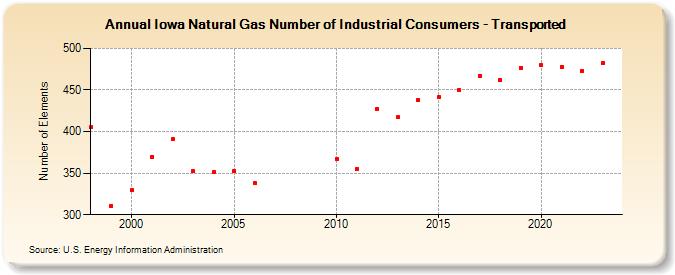
| Iowa Natural Gas Number of Industrial Consumers - Transported (Number of Elements) | |||||
| Decade | Year-0 | Year-1 | Year-2 | Year-3 | Year-4 | Year-5 | Year-6 | Year-7 | Year-8 | Year-9 |
|---|---|---|---|---|---|---|---|---|---|---|
| 1990's | 405 | 311 | ||||||||
| 2000's | 330 | 370 | 391 | 352 | 351 | 353 | 338 | |||
| 2010's | 367 | 355 | 427 | 417 | 438 | 441 | 450 | 467 | 462 | 477 |
| 2020's | 480 | 478 | 473 | 483 | 487 |
| - = No Data Reported; -- = Not Applicable; NA = Not Available; W = Withheld to avoid disclosure of individual company data. |
| Release Date: 6/30/2026 |
| Next Release Date: 7/31/2026 |