|
Download Data (XLS File) |
|
|||||
|
|||||
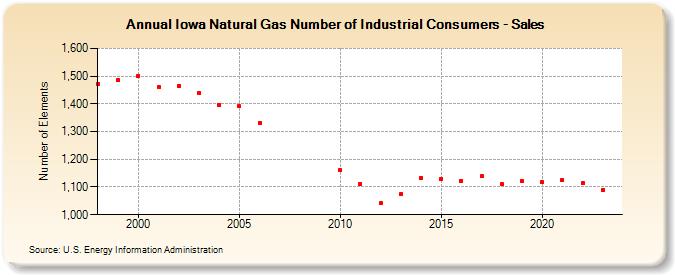
| Iowa Natural Gas Number of Industrial Consumers - Sales (Number of Elements) | |||||
| Decade | Year-0 | Year-1 | Year-2 | Year-3 | Year-4 | Year-5 | Year-6 | Year-7 | Year-8 | Year-9 |
|---|---|---|---|---|---|---|---|---|---|---|
| 1990's | 1,473 | 1,486 | ||||||||
| 2000's | 1,501 | 1,460 | 1,464 | 1,439 | 1,395 | 1,391 | 1,332 | |||
| 2010's | 1,161 | 1,110 | 1,042 | 1,074 | 1,134 | 1,130 | 1,123 | 1,139 | 1,110 | 1,121 |
| 2020's | 1,117 | 1,126 | 1,113 | 1,088 | 1,097 |
| - = No Data Reported; -- = Not Applicable; NA = Not Available; W = Withheld to avoid disclosure of individual company data. |
| Release Date: 6/30/2026 |
| Next Release Date: 7/31/2026 |