|
Download Data (XLS File) |
|
|||||
|
|||||
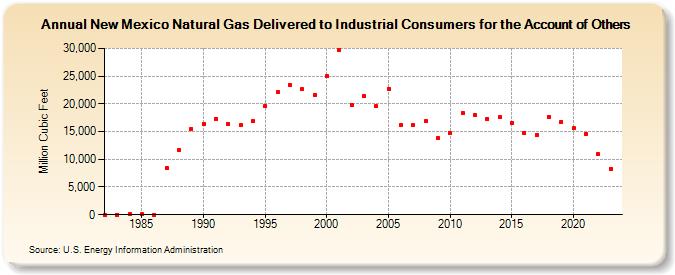
| New Mexico Natural Gas Delivered to Industrial Consumers for the Account of Others (Million Cubic Feet) | |||||
| Decade | Year-0 | Year-1 | Year-2 | Year-3 | Year-4 | Year-5 | Year-6 | Year-7 | Year-8 | Year-9 |
|---|---|---|---|---|---|---|---|---|---|---|
| 1980's | 0 | 0 | 66 | 64 | 0 | 8,448 | 11,611 | 15,473 | ||
| 1990's | 16,346 | 17,305 | 16,339 | 16,107 | 16,884 | 19,596 | 22,049 | 23,412 | 22,603 | 21,598 |
| 2000's | 24,945 | 29,799 | 19,715 | 21,389 | 19,583 | 22,749 | 16,123 | 16,111 | 16,837 | 13,815 |
| 2010's | 14,697 | 18,405 | 18,028 | 17,282 | 17,551 | 16,509 | 14,655 | 14,387 | 17,675 | 16,760 |
| 2020's | 15,575 | 14,574 | 10,946 | 8,315 | 12,902 |
| - = No Data Reported; -- = Not Applicable; NA = Not Available; W = Withheld to avoid disclosure of individual company data. |
| Release Date: 6/30/2026 |
| Next Release Date: 7/31/2026 |