|
Download Data (XLS File) |
|
|||||
|
|||||
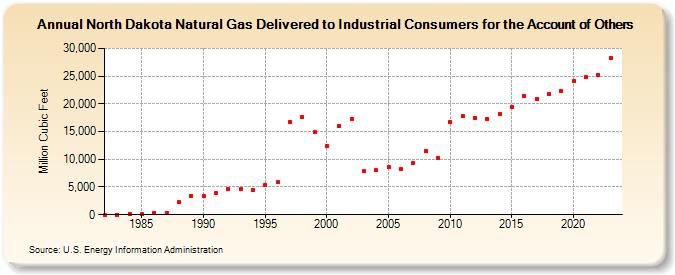
| North Dakota Natural Gas Delivered to Industrial Consumers for the Account of Others (Million Cubic Feet) | |||||
| Decade | Year-0 | Year-1 | Year-2 | Year-3 | Year-4 | Year-5 | Year-6 | Year-7 | Year-8 | Year-9 |
|---|---|---|---|---|---|---|---|---|---|---|
| 1980's | 0 | 0 | 147 | 52 | 373 | 323 | 2,206 | 3,336 | ||
| 1990's | 3,296 | 3,901 | 4,656 | 4,570 | 4,402 | 5,319 | 5,813 | 16,783 | 17,594 | 14,938 |
| 2000's | 12,420 | 16,017 | 17,351 | 7,823 | 8,017 | 8,585 | 8,256 | 9,399 | 11,430 | 10,224 |
| 2010's | 16,699 | 17,721 | 17,433 | 17,278 | 18,128 | 19,380 | 21,356 | 20,875 | 21,694 | 22,265 |
| 2020's | 24,105 | 24,759 | 25,172 | 28,199 | 29,077 |
| - = No Data Reported; -- = Not Applicable; NA = Not Available; W = Withheld to avoid disclosure of individual company data. |
| Release Date: 6/30/2026 |
| Next Release Date: 7/31/2026 |