|
Download Data (XLS File) |
|
|||||
|
|||||
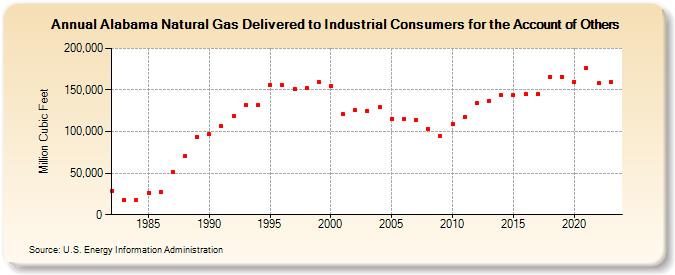
| Alabama Natural Gas Delivered to Industrial Consumers for the Account of Others (Million Cubic Feet) | |||||
| Decade | Year-0 | Year-1 | Year-2 | Year-3 | Year-4 | Year-5 | Year-6 | Year-7 | Year-8 | Year-9 |
|---|---|---|---|---|---|---|---|---|---|---|
| 1980's | 28,602 | 17,518 | 17,656 | 26,554 | 27,643 | 51,415 | 70,229 | 93,168 | ||
| 1990's | 96,889 | 106,274 | 118,457 | 131,817 | 132,073 | 156,374 | 155,962 | 151,727 | 152,823 | 159,663 |
| 2000's | 155,042 | 120,717 | 125,467 | 124,857 | 129,337 | 115,449 | 114,699 | 114,325 | 103,662 | 94,597 |
| 2010's | 109,031 | 117,277 | 133,765 | 137,103 | 143,849 | 143,569 | 145,118 | 145,136 | 166,128 | 166,132 |
| 2020's | 159,976 | 176,381 | 157,915 | 159,132 | 163,218 |
| - = No Data Reported; -- = Not Applicable; NA = Not Available; W = Withheld to avoid disclosure of individual company data. |
| Release Date: 6/30/2026 |
| Next Release Date: 7/31/2026 |