|
Download Data (XLS File) |
|
|||||
|
|||||
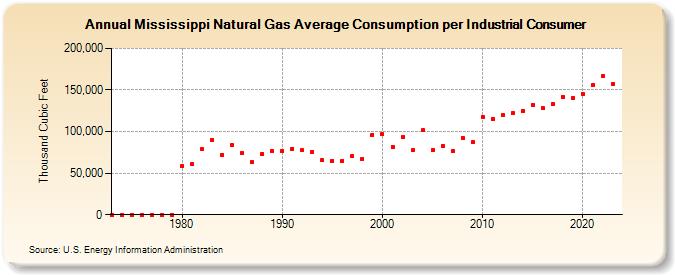
| Mississippi Natural Gas Average Consumption per Industrial Consumer (Thousand Cubic Feet) | |||||
| Decade | Year-0 | Year-1 | Year-2 | Year-3 | Year-4 | Year-5 | Year-6 | Year-7 | Year-8 | Year-9 |
|---|---|---|---|---|---|---|---|---|---|---|
| 1970's | 0 | 0 | 0 | 0 | 0 | 0 | 0 | |||
| 1980's | 58,616 | 60,899 | 78,551 | 89,571 | 72,143 | 83,479 | 74,357 | 62,831 | 73,563 | 76,279 |
| 1990's | 76,539 | 79,621 | 77,326 | 75,654 | 65,487 | 65,120 | 65,178 | 70,031 | 67,502 | 96,415 |
| 2000's | 97,285 | 81,829 | 93,219 | 77,278 | 101,408 | 77,608 | 82,757 | 76,142 | 92,616 | 86,987 |
| 2010's | 117,846 | 115,030 | 119,652 | 122,399 | 125,035 | 132,285 | 128,010 | 133,288 | 141,758 | 140,886 |
| 2020's | 145,302 | 155,450 | 166,473 | 153,066 | 219,227 |
| - = No Data Reported; -- = Not Applicable; NA = Not Available; W = Withheld to avoid disclosure of individual company data. |
| Release Date: 6/30/2026 |
| Next Release Date: 7/31/2026 |