|
Download Data (XLS File) |
|
|||||
|
|||||
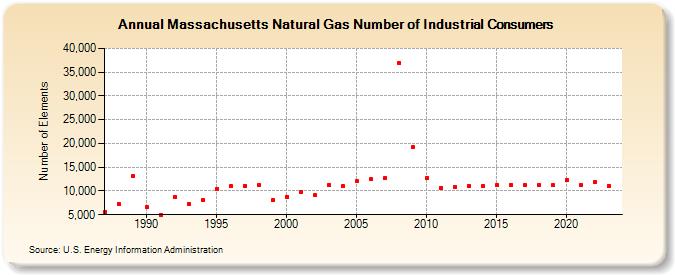
| Massachusetts Natural Gas Number of Industrial Consumers (Number of Elements) | |||||
| Decade | Year-0 | Year-1 | Year-2 | Year-3 | Year-4 | Year-5 | Year-6 | Year-7 | Year-8 | Year-9 |
|---|---|---|---|---|---|---|---|---|---|---|
| 1980's | 5,626 | 7,199 | 13,057 | |||||||
| 1990's | 6,539 | 5,006 | 8,723 | 7,283 | 8,019 | 10,447 | 10,952 | 11,058 | 11,245 | 8,027 |
| 2000's | 8,794 | 9,750 | 9,090 | 11,272 | 10,949 | 12,019 | 12,456 | 12,678 | 36,928 | 19,208 |
| 2010's | 12,751 | 10,721 | 10,840 | 11,063 | 10,946 | 11,266 | 11,334 | 11,196 | 11,205 | 11,196 |
| 2020's | 12,240 | 11,223 | 11,823 | 11,097 | 10,916 |
| - = No Data Reported; -- = Not Applicable; NA = Not Available; W = Withheld to avoid disclosure of individual company data. |
| Release Date: 6/30/2026 |
| Next Release Date: 7/31/2026 |