|
Download Data (XLS File) |
|
|||||
|
|||||
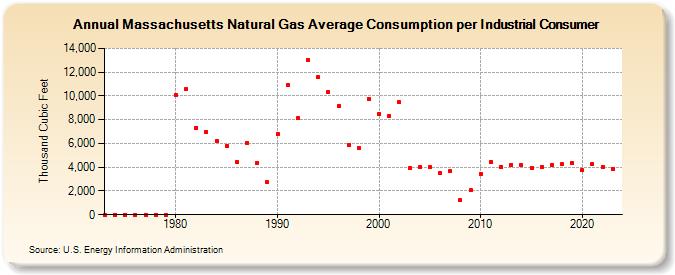
| Massachusetts Natural Gas Average Consumption per Industrial Consumer (Thousand Cubic Feet) | |||||
| Decade | Year-0 | Year-1 | Year-2 | Year-3 | Year-4 | Year-5 | Year-6 | Year-7 | Year-8 | Year-9 |
|---|---|---|---|---|---|---|---|---|---|---|
| 1970's | 0 | 0 | 0 | 0 | 0 | 0 | 0 | |||
| 1980's | 10,102 | 10,588 | 7,341 | 6,996 | 6,224 | 5,820 | 4,449 | 6,070 | 4,386 | 2,726 |
| 1990's | 6,779 | 10,937 | 8,125 | 12,997 | 11,572 | 10,312 | 9,132 | 5,862 | 5,605 | 9,726 |
| 2000's | 8,513 | 8,327 | 9,456 | 3,915 | 3,977 | 3,975 | 3,478 | 3,655 | 1,210 | 2,051 |
| 2010's | 3,469 | 4,439 | 4,052 | 4,219 | 4,164 | 3,955 | 4,034 | 4,198 | 4,241 | 4,356 |
| 2020's | 3,738 | 4,236 | 4,033 | 3,883 | 4,019 |
| - = No Data Reported; -- = Not Applicable; NA = Not Available; W = Withheld to avoid disclosure of individual company data. |
| Release Date: 6/30/2026 |
| Next Release Date: 7/31/2026 |