|
Download Data (XLS File) |
|
|||||
|
|||||
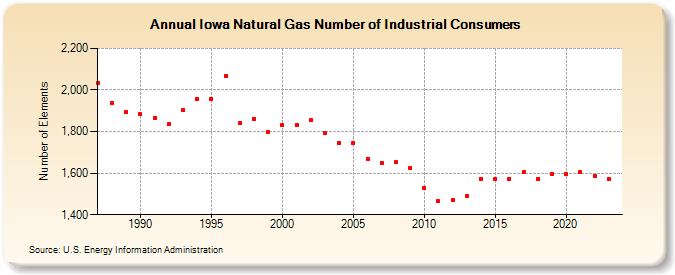
| Iowa Natural Gas Number of Industrial Consumers (Number of Elements) | |||||
| Decade | Year-0 | Year-1 | Year-2 | Year-3 | Year-4 | Year-5 | Year-6 | Year-7 | Year-8 | Year-9 |
|---|---|---|---|---|---|---|---|---|---|---|
| 1980's | 2,033 | 1,937 | 1,895 | |||||||
| 1990's | 1,883 | 1,866 | 1,835 | 1,903 | 1,957 | 1,957 | 2,066 | 1,839 | 1,862 | 1,797 |
| 2000's | 1,831 | 1,830 | 1,855 | 1,791 | 1,746 | 1,744 | 1,670 | 1,651 | 1,652 | 1,626 |
| 2010's | 1,528 | 1,465 | 1,469 | 1,491 | 1,572 | 1,571 | 1,573 | 1,606 | 1,572 | 1,598 |
| 2020's | 1,597 | 1,604 | 1,586 | 1,571 | 1,584 |
| - = No Data Reported; -- = Not Applicable; NA = Not Available; W = Withheld to avoid disclosure of individual company data. |
| Release Date: 6/30/2026 |
| Next Release Date: 7/31/2026 |